

CDAHFD-induced Rat MASH Model
Metabolic Dysfunction-Associated Steatohepatitis (MASH), formerly known as non-alcoholic steatohepatitis (NASH), is the progressive inflammatory stage of metabolic dysfunction-associated steatotic liver disease (MASLD). It is characterized by hepatic steatosis (≥5% fat accumulation), inflammation, hepatocyte injury (ballooning), and fibrosis, which can progress to cirrhosis and hepatocellular carcinoma (HCC).
CDAHFD-induced rat MASH model
The choline-deficient, L-amino acid-defined, high-fat diet (CDAHFD)-induced rat model is a widely used preclinical system for studying metabolic dysfunction-associated steatohepatitis (MASH), particularly for investigating steatohepatitis, fibrosis progression, and therapeutic interventions. This model efficiently recapitulates key features of human MASH within a relatively short time frame (6–12 weeks).
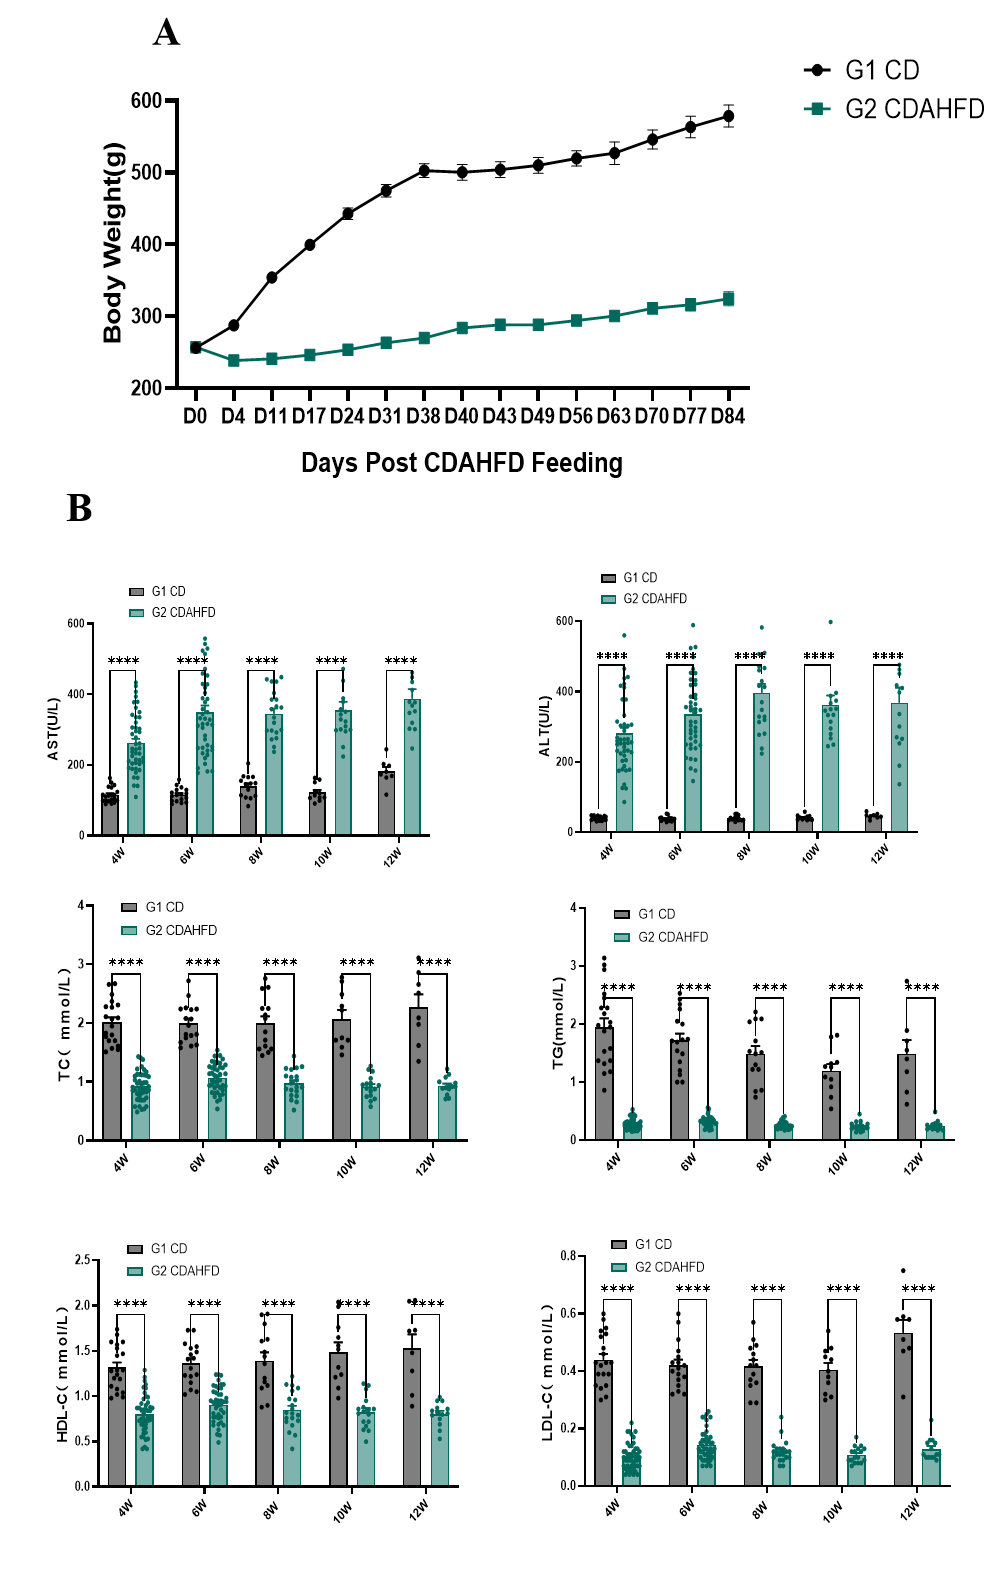
Fig.1 Body weight and serum ALT, AST, TC, TG, HDL-C and LDL-C of CDAHFD-induced rat MASH model
Body weight curve of CDAHFD-induced rat MASH model is shown in Fig. 1A. The serum level of AST and ALT were significantly higher in CDAHFD-induced MASH rats compared to the CD group, while the serum TC, TG, HDL-C, and LDL-C level is lower (Fig. 1B). Data were presented by mean ± SEM, N=8-30. *, p < 0.05; **, p < 0.01; ***, p < 0.001 and ****, p < 0.0001
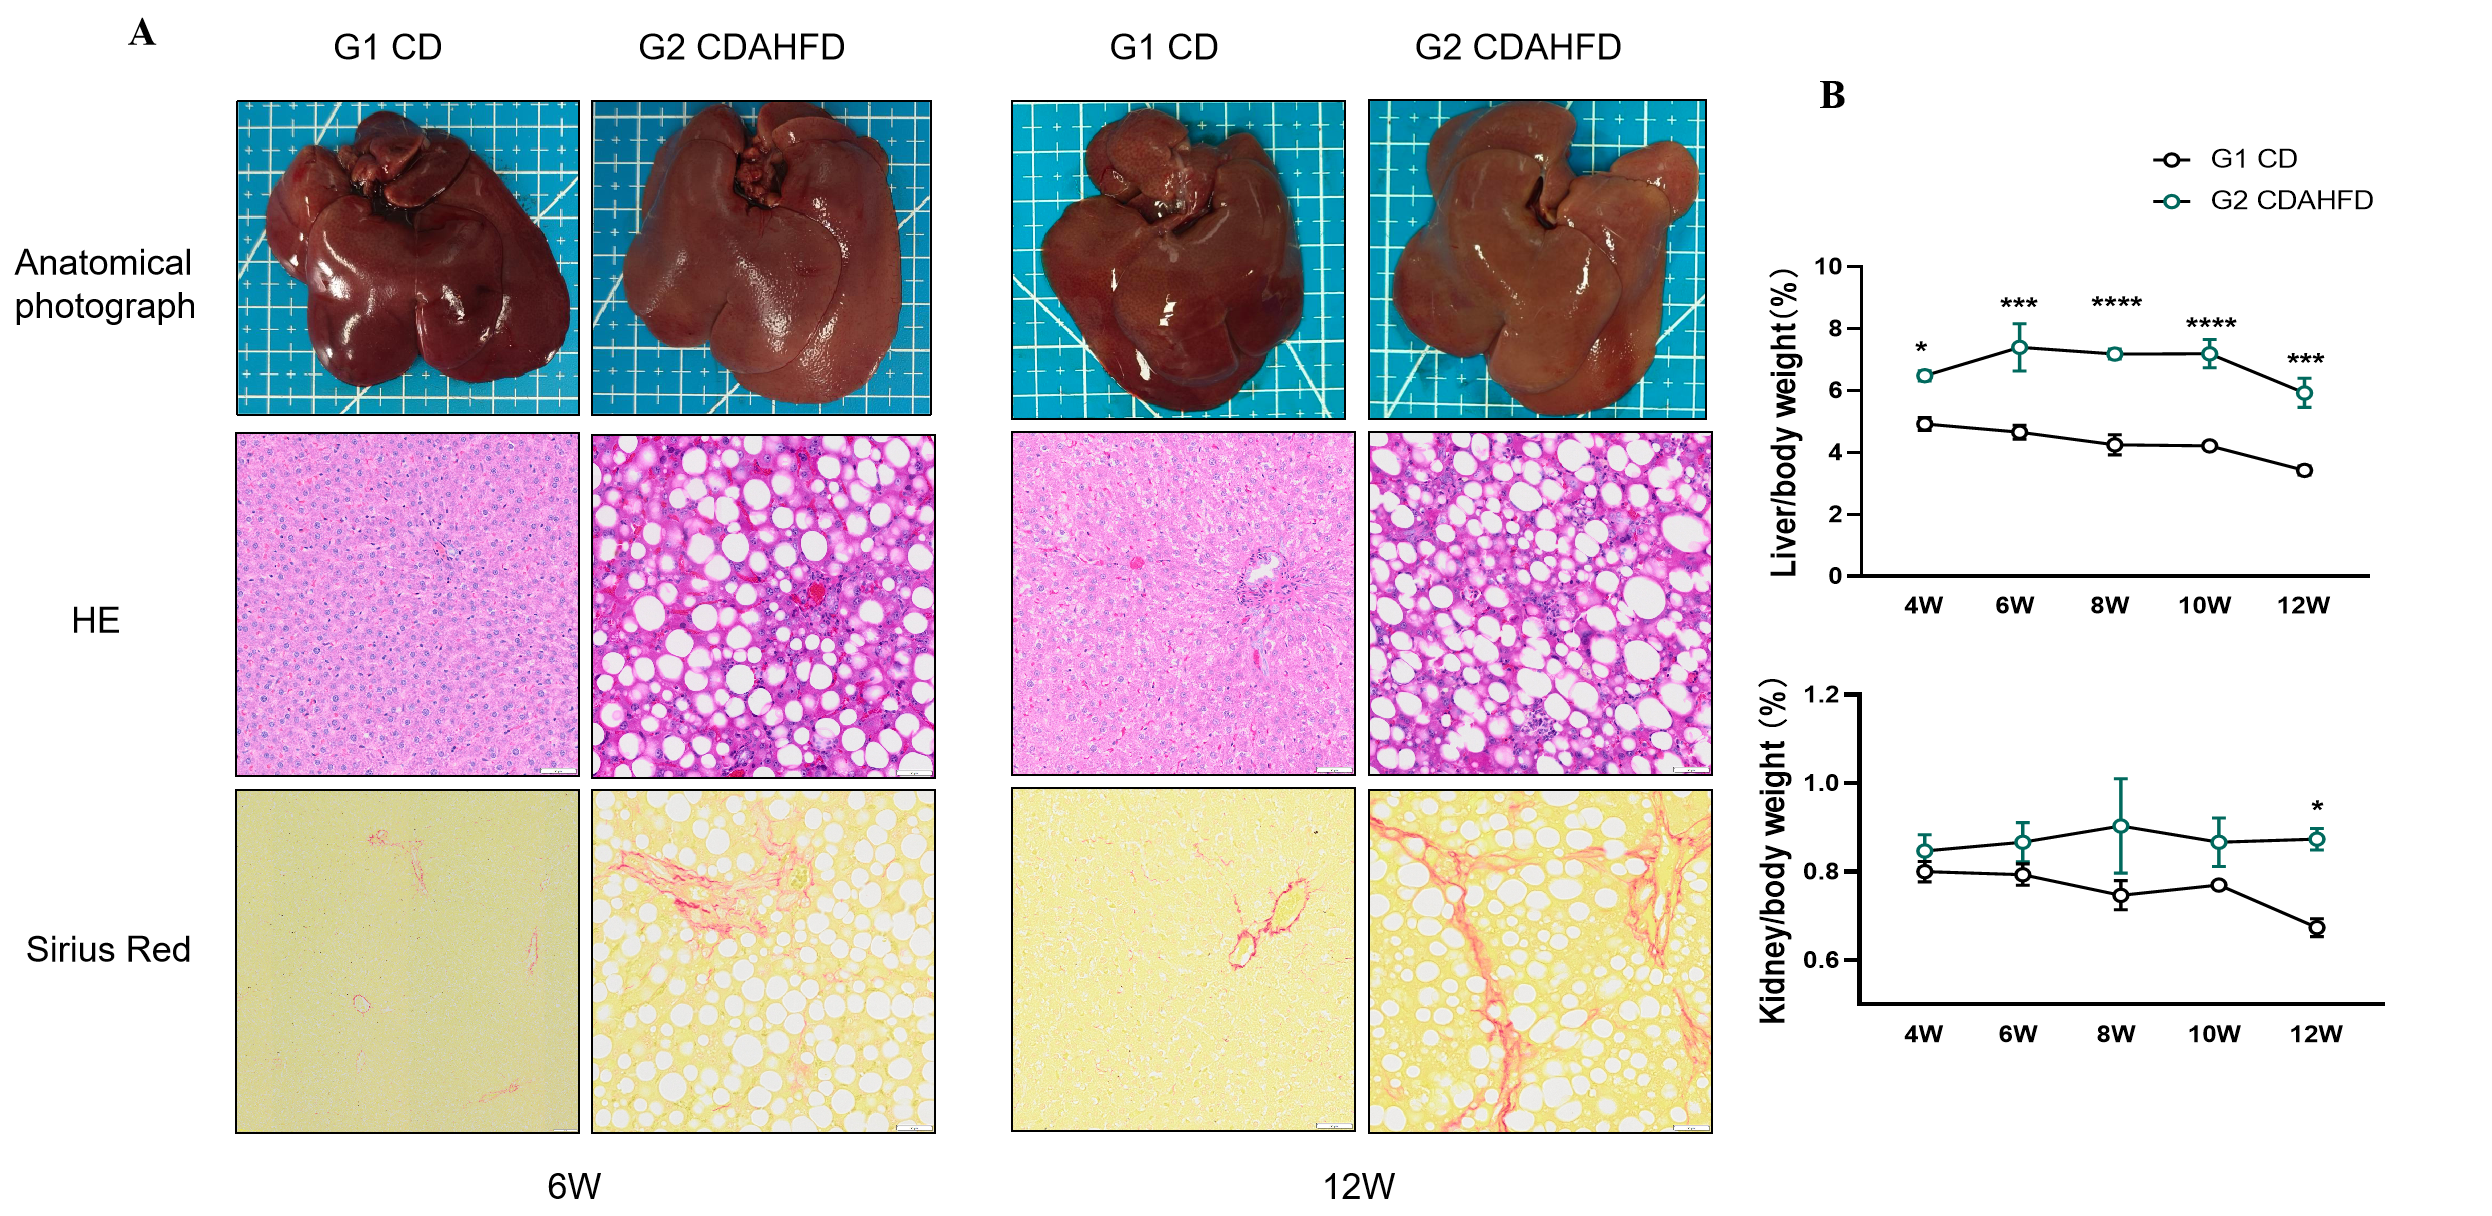
Fig.2 Histological observation of CDAHFD-induced rat MASH model
Obvious lipid droplet deposition and fibrous tissue hyperplasia were observed in liver of CDAHFD-induced rat MASH model via Pathological staining (HE and Sirius Red staining, Fig. 2A). The Liver/body weight ratio of CDAHFD-induced MASH model is higher than that of CD group as well as the kidney/body weight ratio. Data presented by mean ± SEM, N=3. *, p<0.05; **, p<0.01; ***, p<0.001 and ****, p<0.0001.
Pharmacodynamic evaluation Firsocostat(MGL3196) on CDAHFD-induced rat MASH model
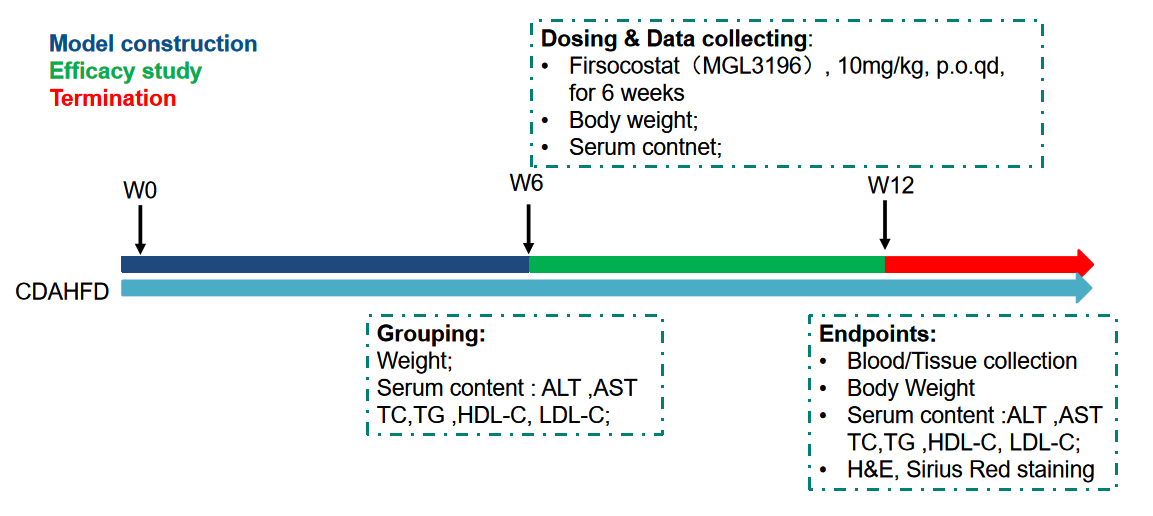
Fig.3 Overview of pharmacodynamic evaluation on CDAHFD-induced rat MASH model

Fig.4 Body weight of CDAHFD-induced rat MASH model after SAME treatment.
There is no significant difference between the model group and the Firsocostat treated group in body weight. Data were presented by mean ± SEM, N=14-20.
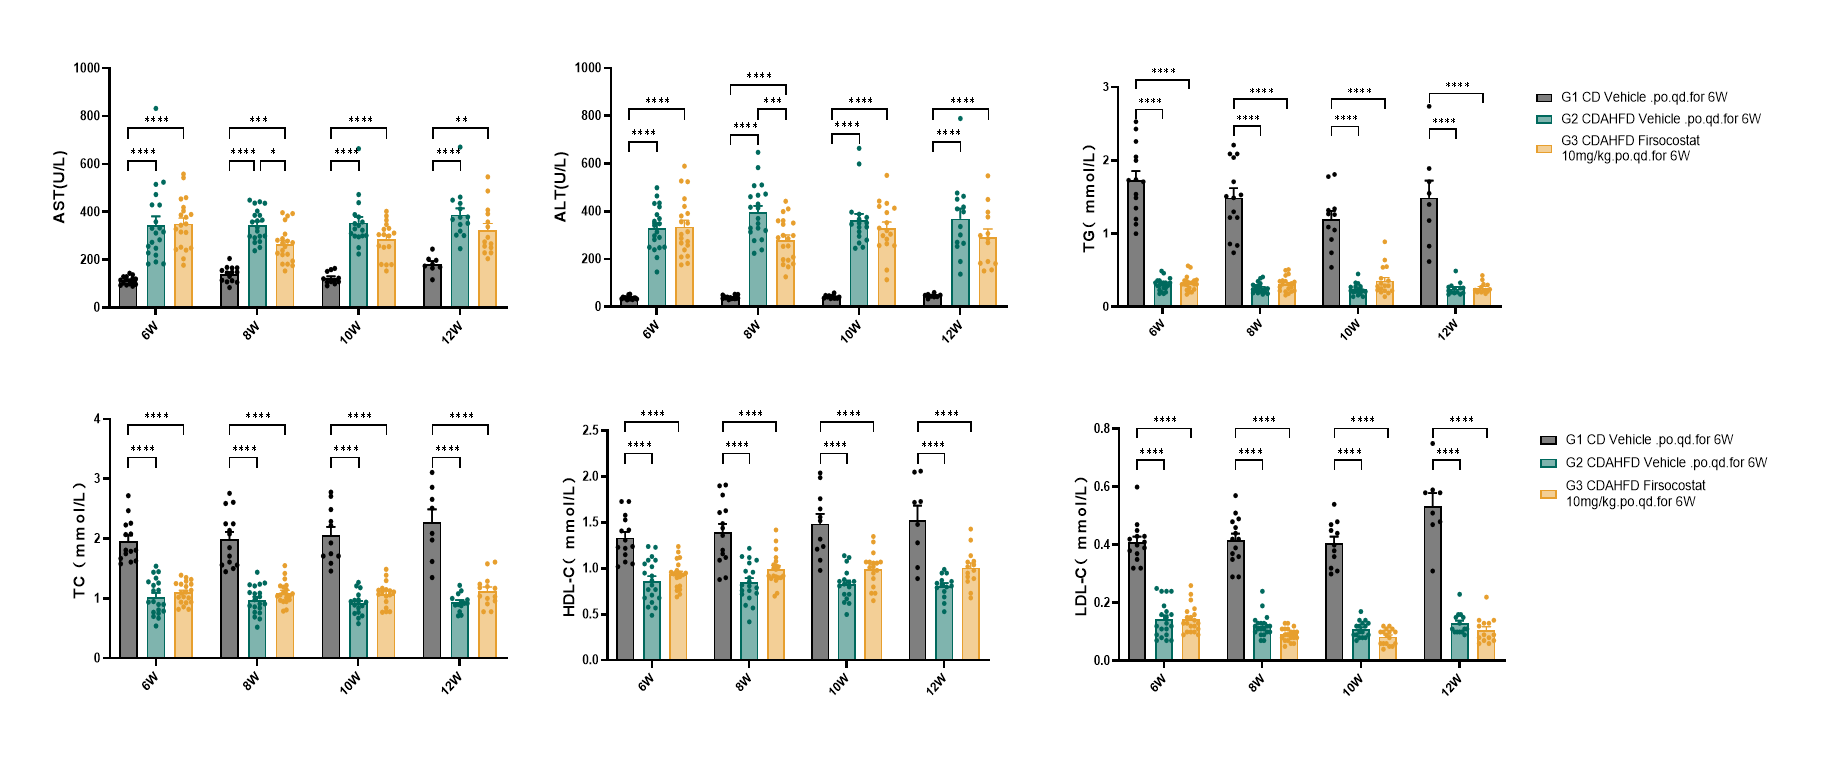
Fig.5 Serum ALT, AST, TC, TG, HDL-C and LDL-C of CDAHFD-induced rat MASH model after Firsocostat treatment
Firsocostat administration reduced serum levels of alanine aminotransferase (ALT) and aspartate aminotransferase (AST) in the CDAHFD-induced rat MASH model, whereas triglyceride (TG), total cholesterol (TC), high-density lipoprotein cholesterol (HDL-C), and low-density lipoprotein cholesterol (LDL-C) profiles remained unaltered. Data were presented by mean ± SEM, N=14-20. *, p < 0.05; **, p < 0.01; ***, p < 0.001 and ****, p < 0.0001.
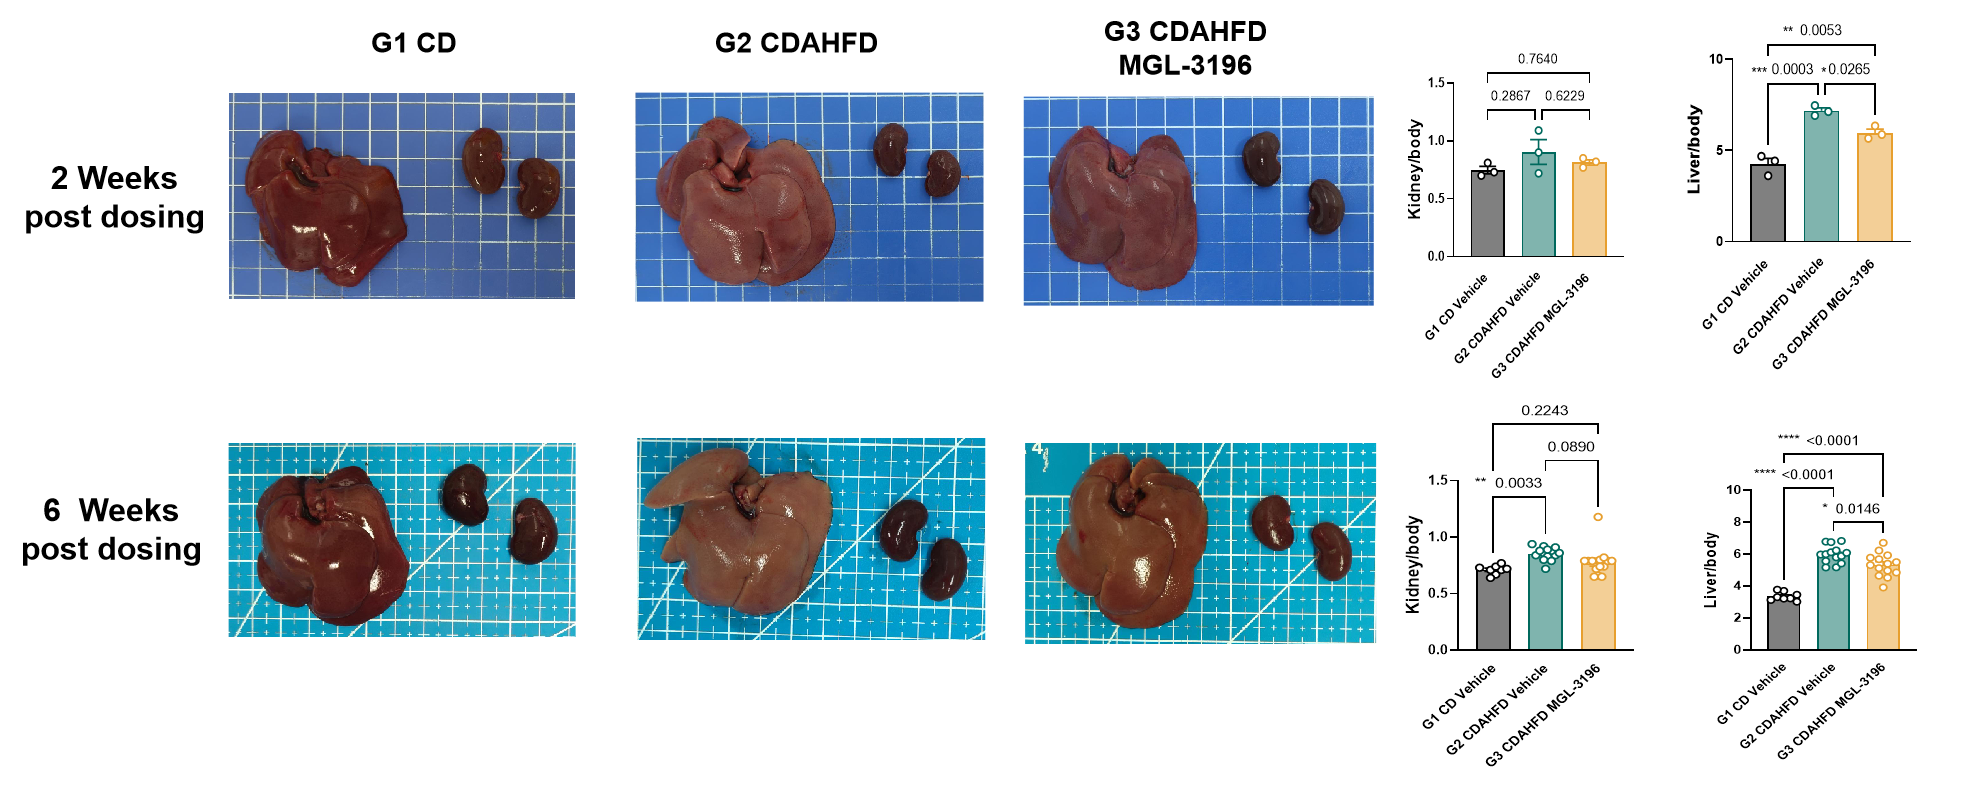
Fig.6 The Liver/body weight% and kidney/body weight% of CDAHFD-induced rat MASH model after Firsocostat treatment
The Liver/body weight and kidney/body weight of CDAHFD induced rat MASH model decreased after 6 weeks Firsocostat treatment. Data were presented by mean ± SEM, N=8-20. *, p < 0.05; **, p < 0.01; ***, p < 0.001 and ****, p < 0.0001
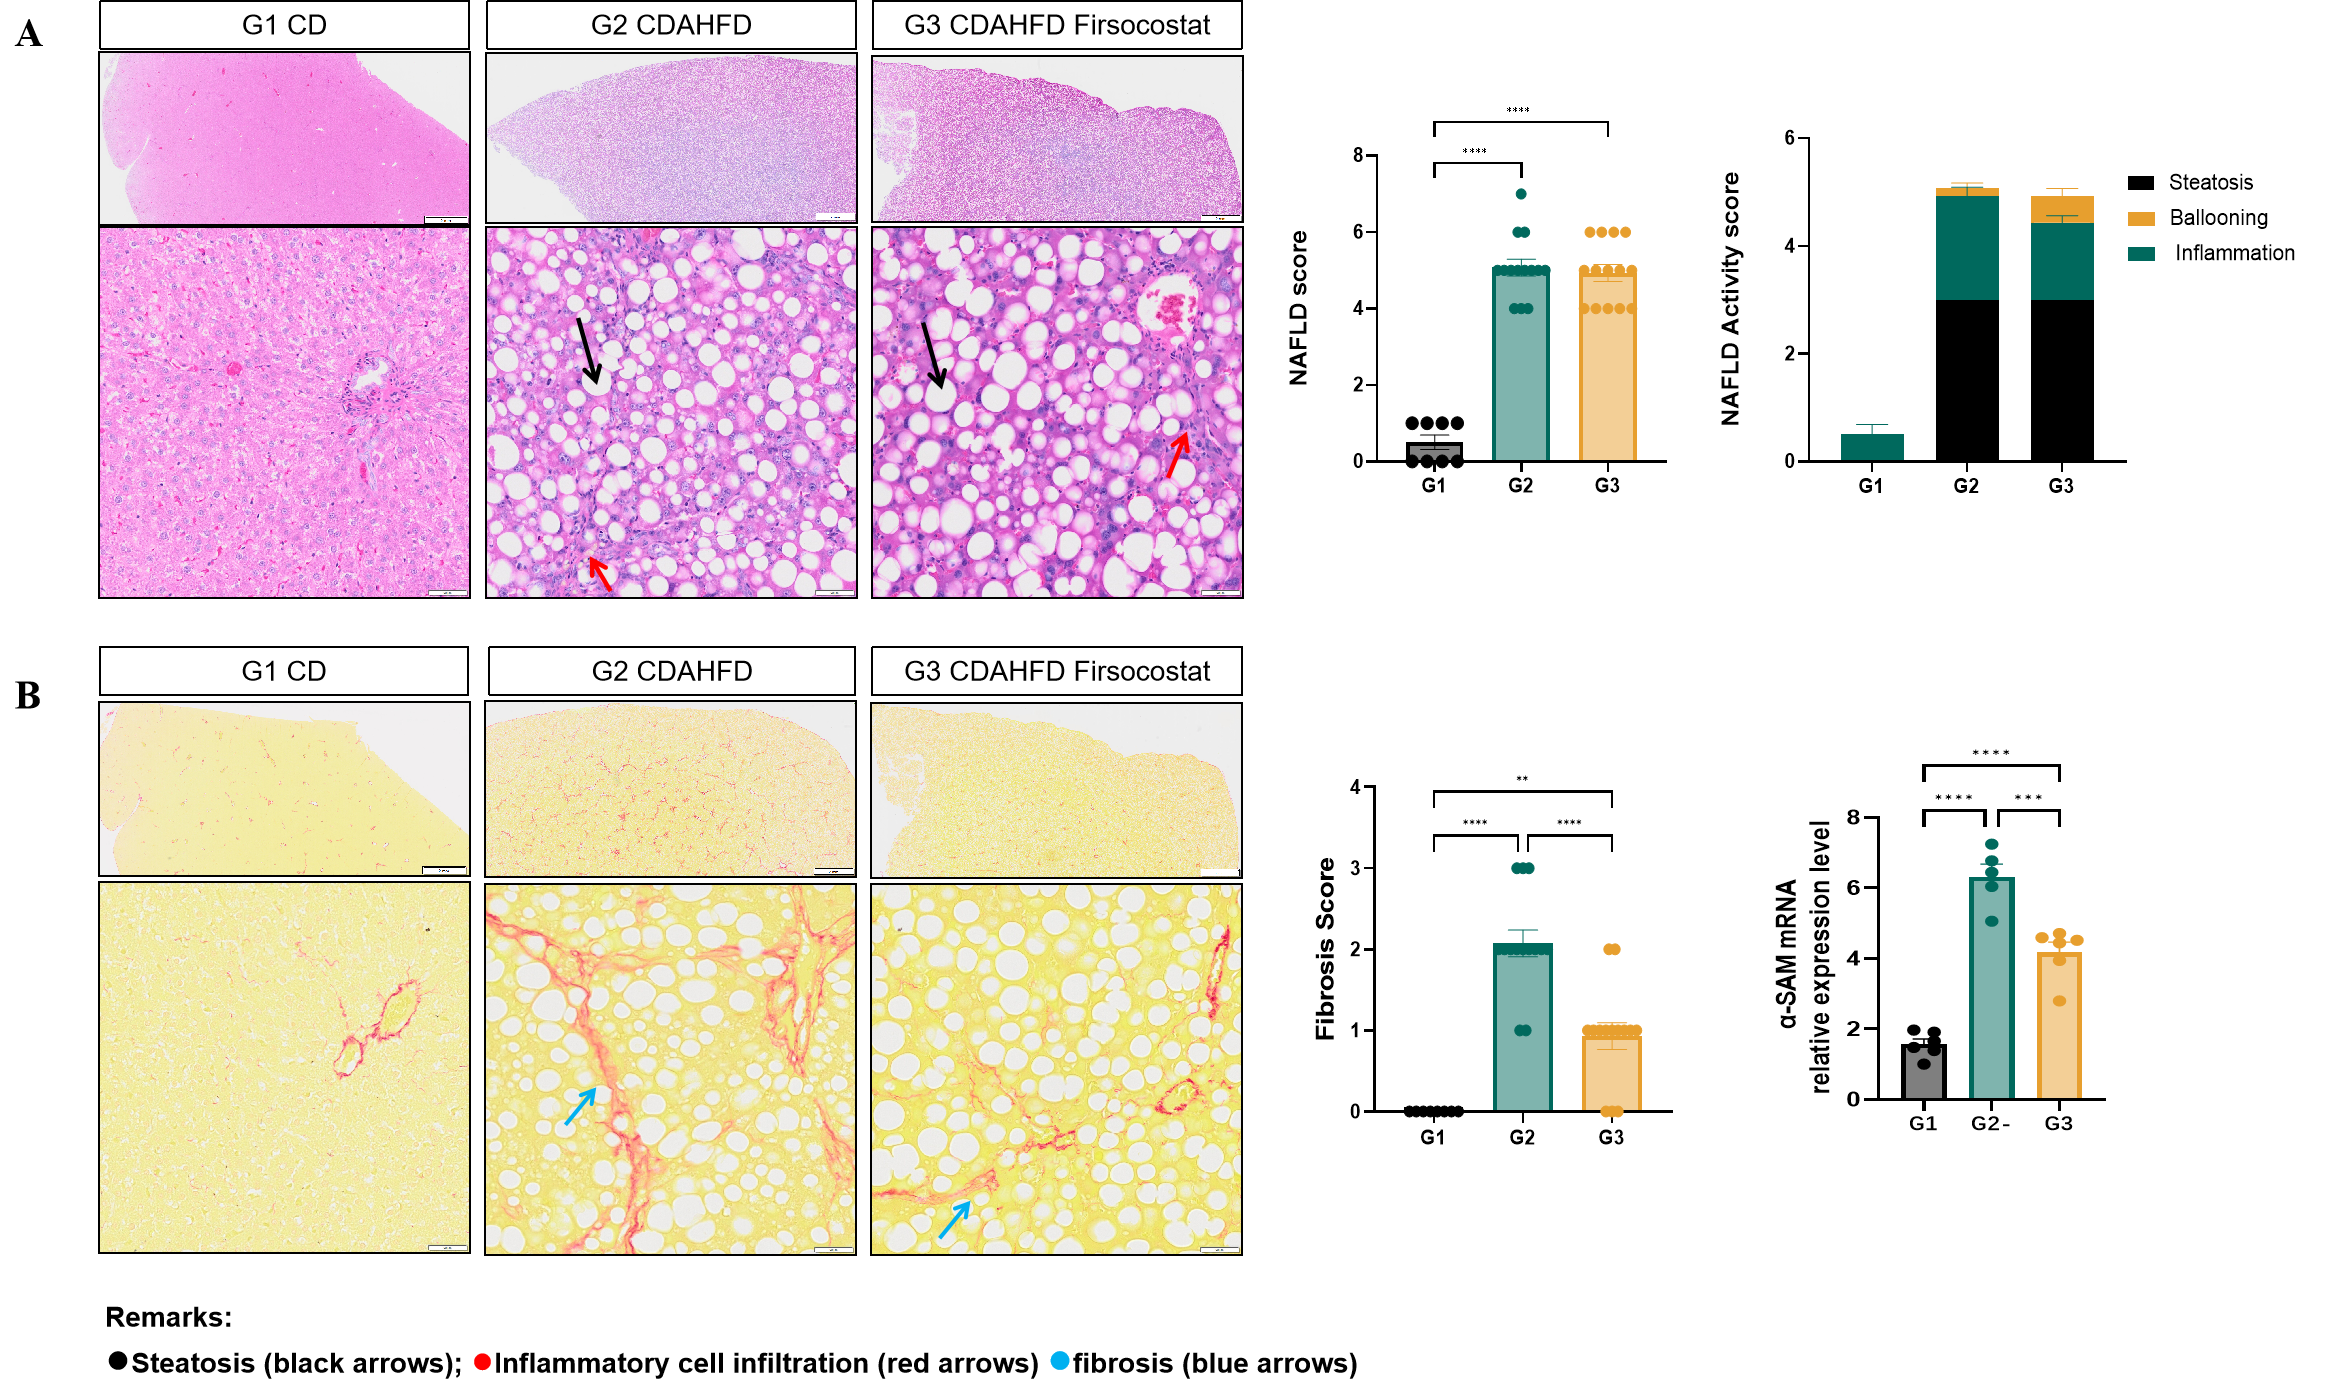
Fig.7 Histological observation of CDAHFD induced rat MASH model after Firsocostat treatment
After six weeks of Firsocostat administration, no significant improvement in the histopathological NAFLD activity score was observed in CDAHFD-induced rat MASH models (Fig. 7A). However, significant reductions in fibrosis score and α-SMA mRNA expression were detected, suggesting a selective antifibrotic effect (Fig. 7B). Data were presented by mean ± SEM, N=6. *, p < 0.05; **, p < 0.01; ***, p < 0.001 and ****, p < 0.0001