

Diabetes Nephropathy (Diabetic Kidney Disease) Models and Efficacy Services
Diabetic nephropathy is one of the most common complications of diabetes, affecting 20-50% of diabetic patients. The pathogenesis of diabetic nephropathy is complex, with metabolic disorders (chronic hyperglycemia) and systemic hypertension being key factors in promoting the progression of renal disease. Currently, preclinical animal models for diabetic kidney disease are primarily constructed and developed based on various type 1 and type 2 diabetes models, many of which fail to recapitulate the full complexity of the disease. For example, while commonly used diabetic mouse models such as the streptozotocin-induced type 1 diabetic mice and the type 2 diabetic BKS-Lepr-/- (db/db mice) can exhibit mild to moderate albuminuria, they fail to demonstrate the structural characteristics commonly observed in patients with advanced diabetic nephropathy, such as glomerulosclerosis and tubular casts at the kidney tissue level. Therefore, those commonly used diabetic mouse models only simulate the features of early-stage diabetic nephropathy in clinical settings and cannot effectively evaluate the potential therapeutic effects of related drugs on mid to late-stage conditions.
GemPharmatech has developed two kinds of progressive diabetic kidney disease mouse models based on BKS-Lepr-/- using gene editing techniques to knock out the Nos3 gene or using virus transduction to overexpress Renin, which induces systemic hypertension and endothelial injury, accelerating renal lesions in BKS-Lepr-/- mice.
BKS-Lepr-/- Nos3-/- Model
BKS-Lepr-/- Nos3-/- mice develop severe albuminuria
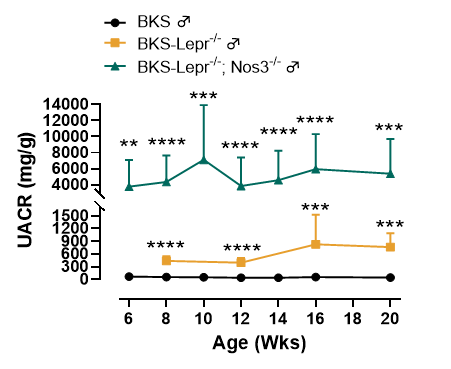
Figure 1. BKS-Lepr-/- Nos3-/- mice display higher UACR level compared to BKS-Lepr-/- mice
Data presented as Mean±SD, N=3~21, **, p < 0.01; ***, p < 0.001 and ****, p < 0.0001 Vs BKS-Lepr-/- mice by one-way ANOVA with Dunnett’s pot-hoc test.
Progressive renal lesions in BKS-Lepr-/- Nos3-/- mice
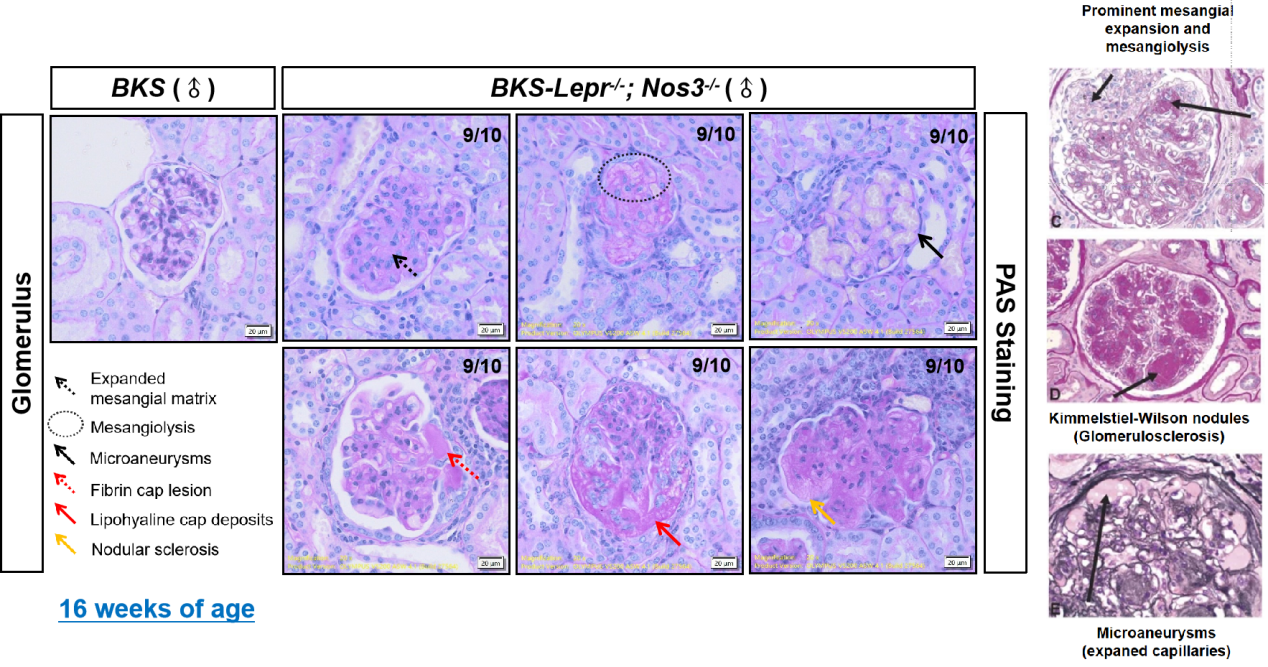
Figure 2. Glomerular lesions in 16 weeks of age BKS-Lepr-/- Nos3-/- mice (left, PAS staining) compared to the typical glomerular lesions in patients with clinical diabetic nephropathy (right)
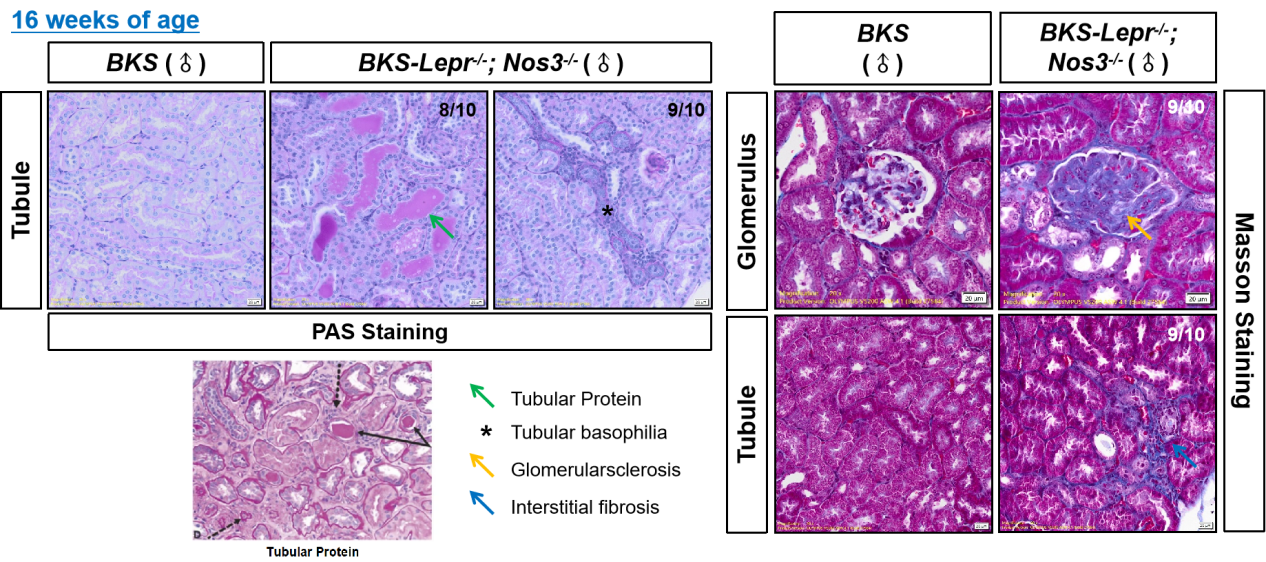
Figure 3. Tubular lesions in 16 week old BKS-Lepr-/- Nos3-/- mice (left upper, PAS staining) compared to the typical tubular lesions in patients with clinical diabetic nephropathy (left bottom); Renal fibrosis in 16-week-old BKS-Lepr-/- Nos3-/- mice (right, Masson staining).
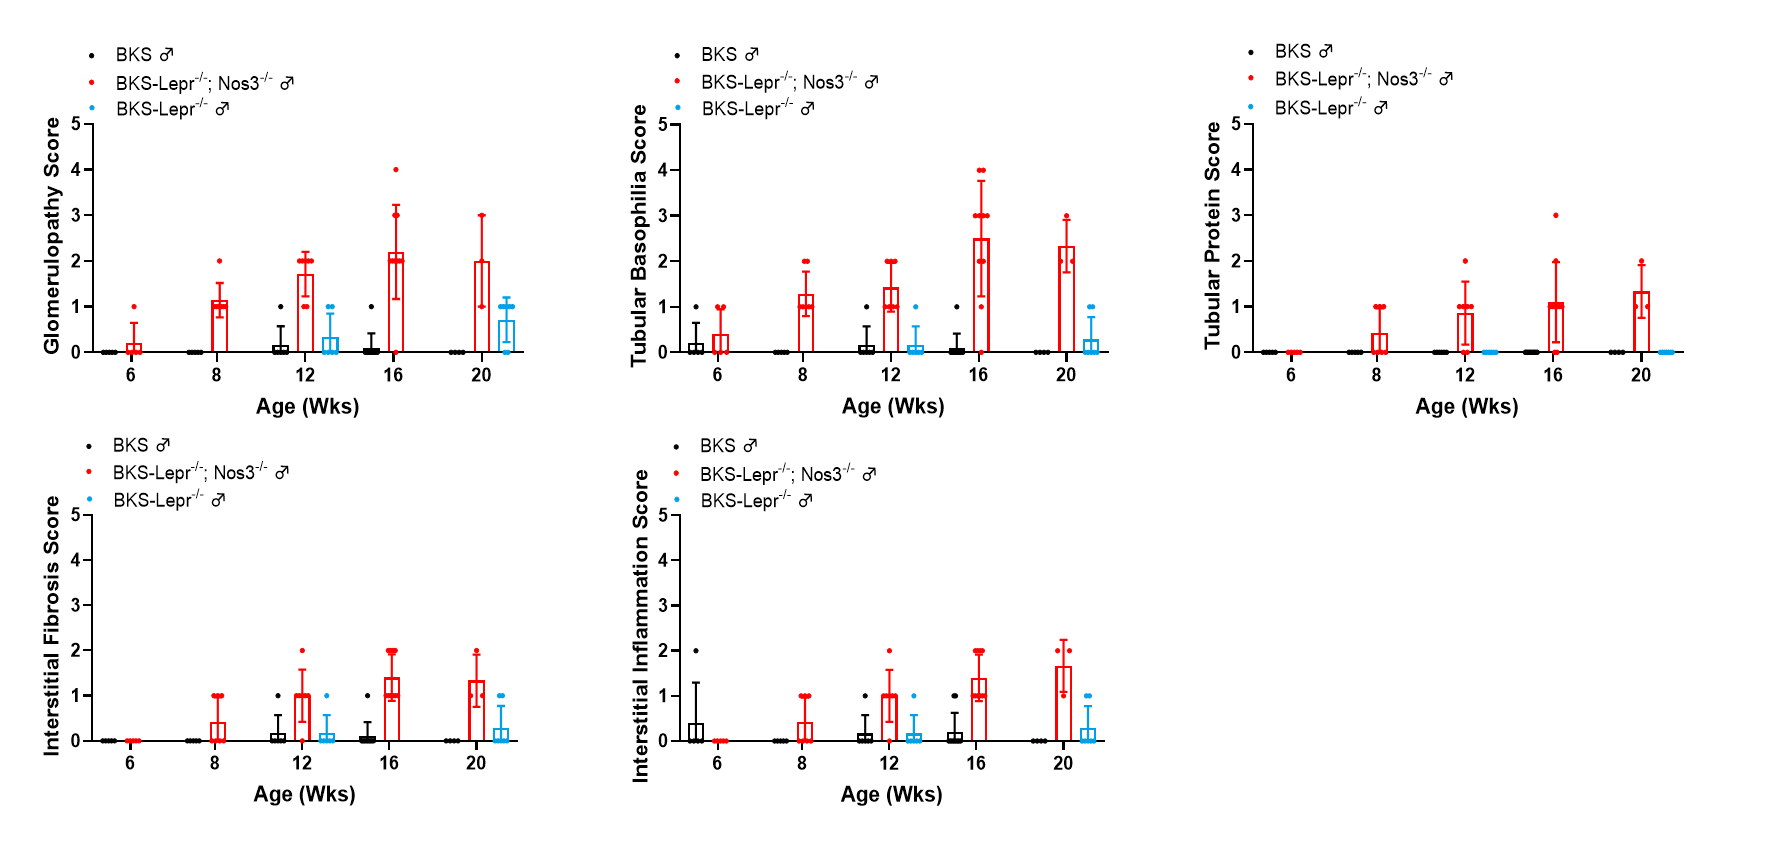
Figure 4. Summarized data of renal histopathological evaluation of BKS-Lepr-/- Nos3-/-mice from 6-20 weeks of age. Data presented as Mean±SD, n=3~9.
The drug efficacy study in BKS-Lepr-/- Nos3-/- mice (Semaglutide+Lisinopril)
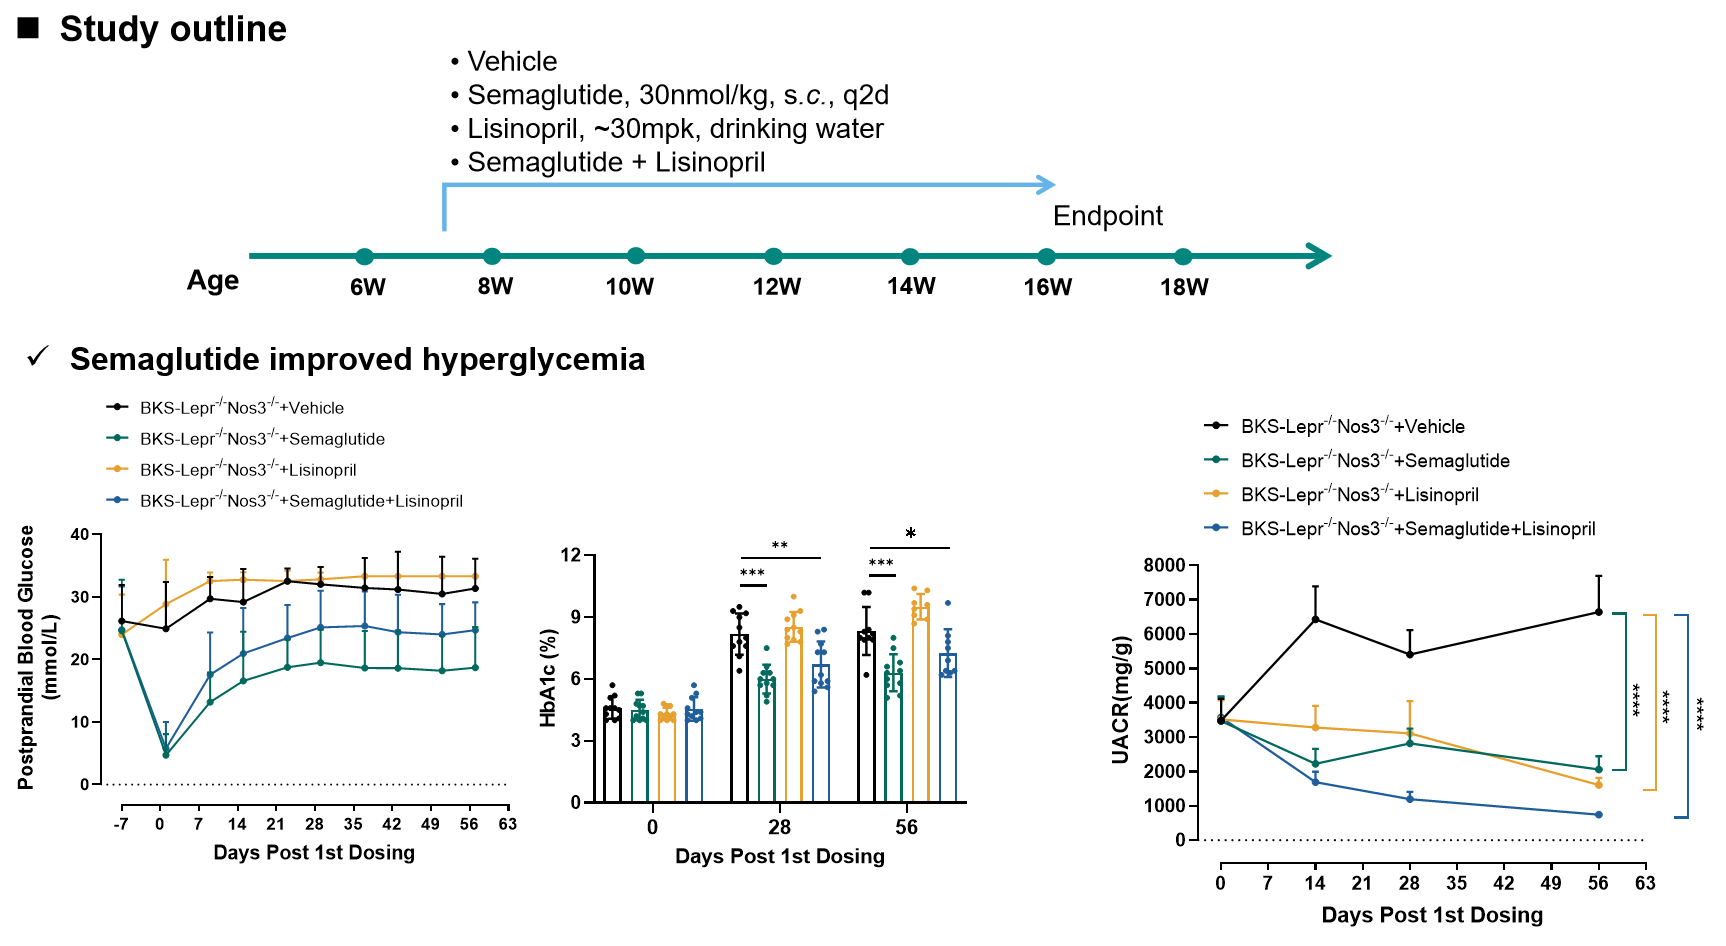
Figure 5. Semaglutide and Lisinopril both improved albuminuria in BKS-Lepr-/- Nos3-/- mice.
Data presented as Mean±SD, n=7~8. *, p<0.05; **, p<0.01; ***, p<0.001 by one-way ANOVA with Dunnett’s pot-hoc test.
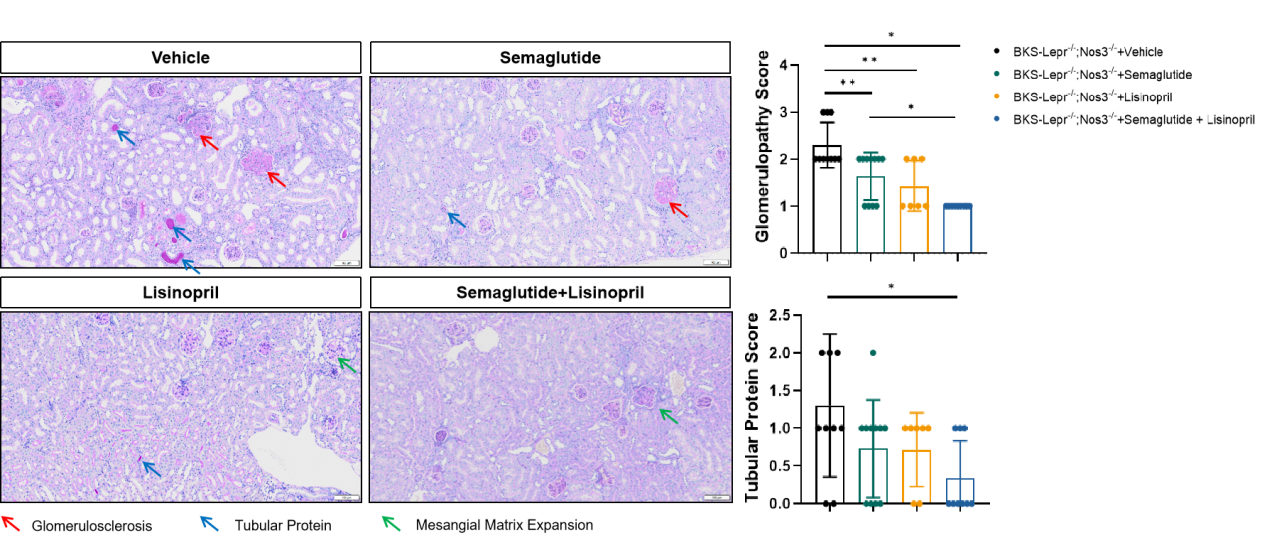
Figure 6 Semaglutide and Lisinopril improved glomerular and tubular lesions in BKS-Lepr-/- Nos3-/- mice.
Data are presented as Mean±SD, n=7~8. *, p<0.05; **, p<0.01 by one-way ANOVA with Dunnett’s pot-hoc test.
AAV-mRenin+BKS-Lepr-/- Model
mRenin overexpression exacerbates albuminuria in BKS-Lepr-/- mice
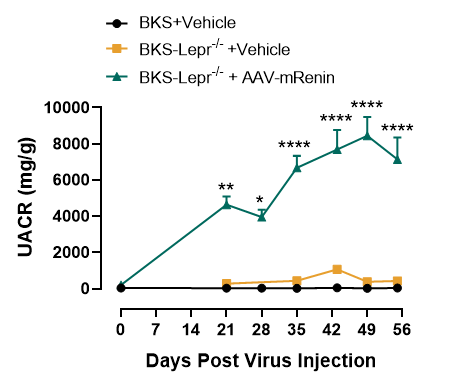
Figure 7. Elevated UACR levels in BKS-Lepr-/- mice after mRenin-Virus injection
Data presented as Mean±SD, n=6~16. *, p<0.05; **, p<0.01; ***, p<0.001 by one-way ANOVA with Dunnett’s pot-hoc test.
AAV-mRenin+BKS-Lepr-/- mice exhibit progressive renal lesions
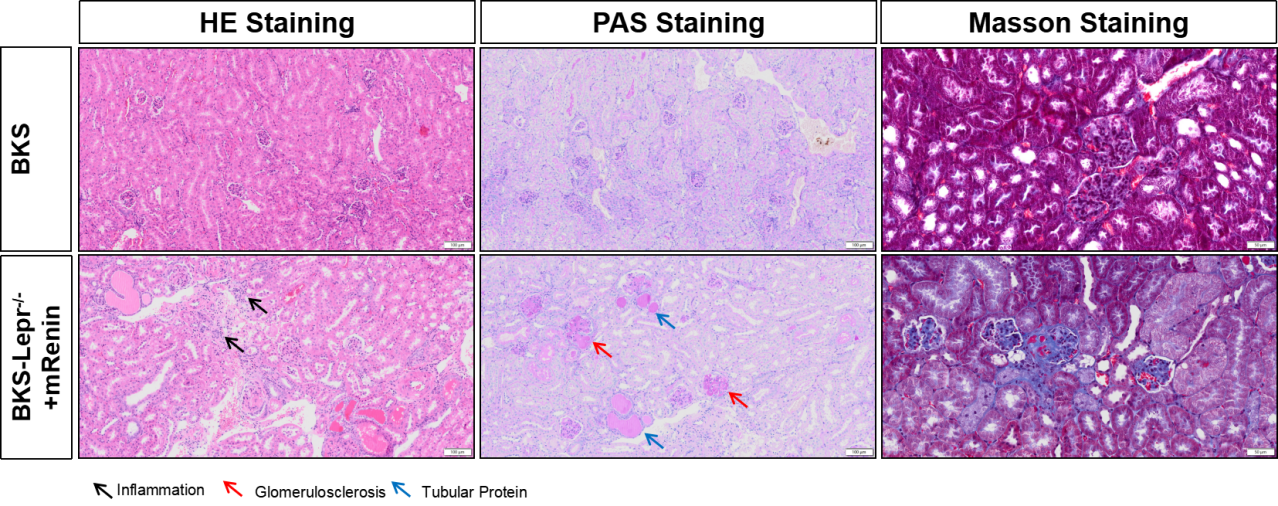
Figure 8. BKS-Lepr-/-mice develop glomerularsclerosis and tubular protein 8 weeks post Renin Virus injection.
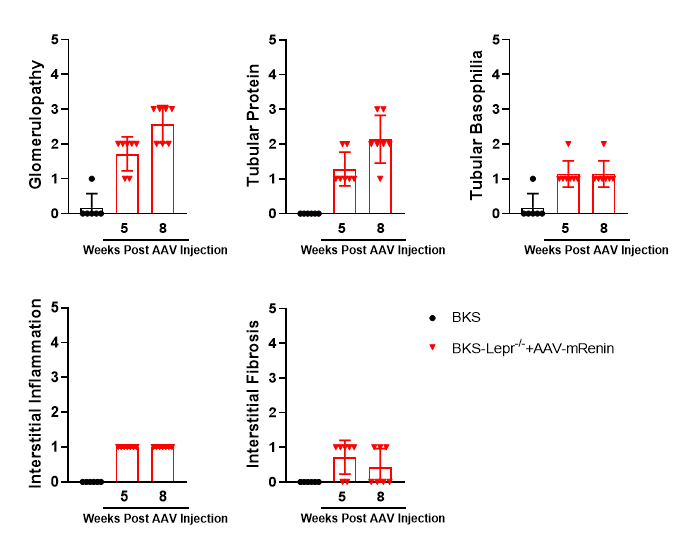
Figure 9. Summarized data of renal histopathological evaluation of AAV-mRenin+BKS-Lepr-/- model. Data presented as Mean±SD, n=6~7.