

Adenine-induced Rat CKD Model
Chronic kidney failure, also known as chronic kidney disease (CKD), is a progressive and irreversible deterioration of kidney function over months or years. It results in the kidneys' inability to effectively filter waste, regulate electrolytes, maintain fluid balance, and produce essential hormones.
Adenine-induced rat CKD model
The adenine-induced CKD model is a well-established non-surgical method to induce chronic kidney failure in rats. Adenine administration leads to crystal deposition in renal tubules, triggering tubulointerstitial inflammation, fibrosis, and progressive renal dysfunction, closely resembling human chronic tubulointerstitial nephropathy.
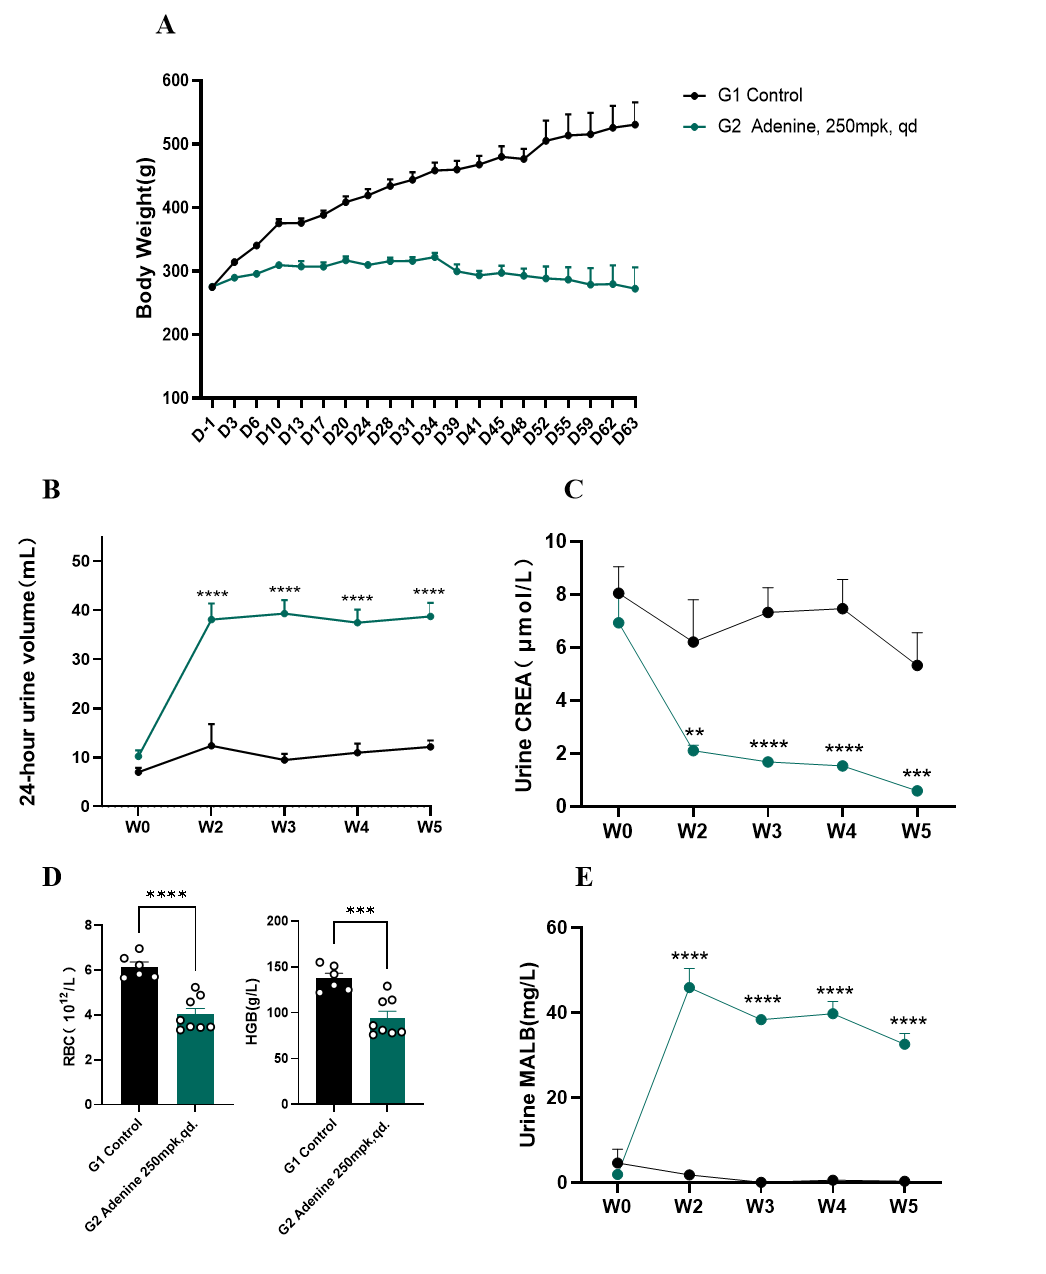
Fig.1 Body weight, RBC, HGB and urine biochemistry of adenine-induced rat CKD model
Body weight curve of adenine-induced rat CKD model is shown in Fig. 1A. The 24h-urine volume and urine MALB level were significantly higher in adenine-induced CKD rats compared to the control group, while the urine creatinine level was lower (Fig. 1B-C,E). RBC and HGB levels were significantly lower in adenine-induced CKD rats compared to the control group after 6weeks (Fig. 1D). Data were presented by mean ± SEM, n=6-8. *, p < 0.05; **, p < 0.01; ***, p < 0.001 and ****, p < 0.0001
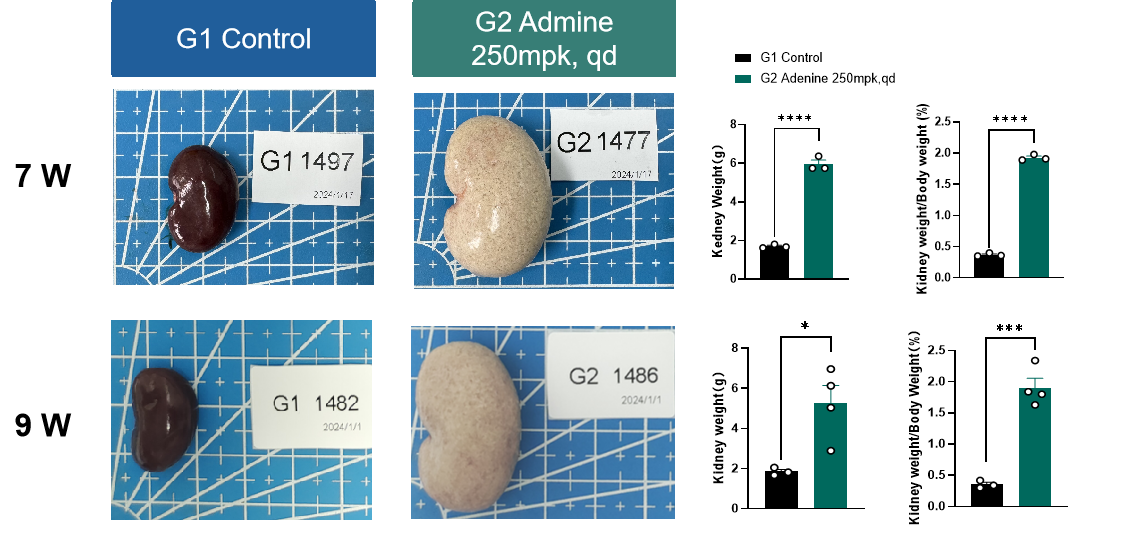
Fig.2 Kidney weight of adenine-induced rat CKD model
The kidney weight of adenine-induced CKD model was significantly higher than that of CD group as well as the kidney/body weight ratio . Data presented by mean ± SEM, n=3. *, p < 0.05; **, p < 0.01; ***, p < 0.001 and ****, p < 0.0001.
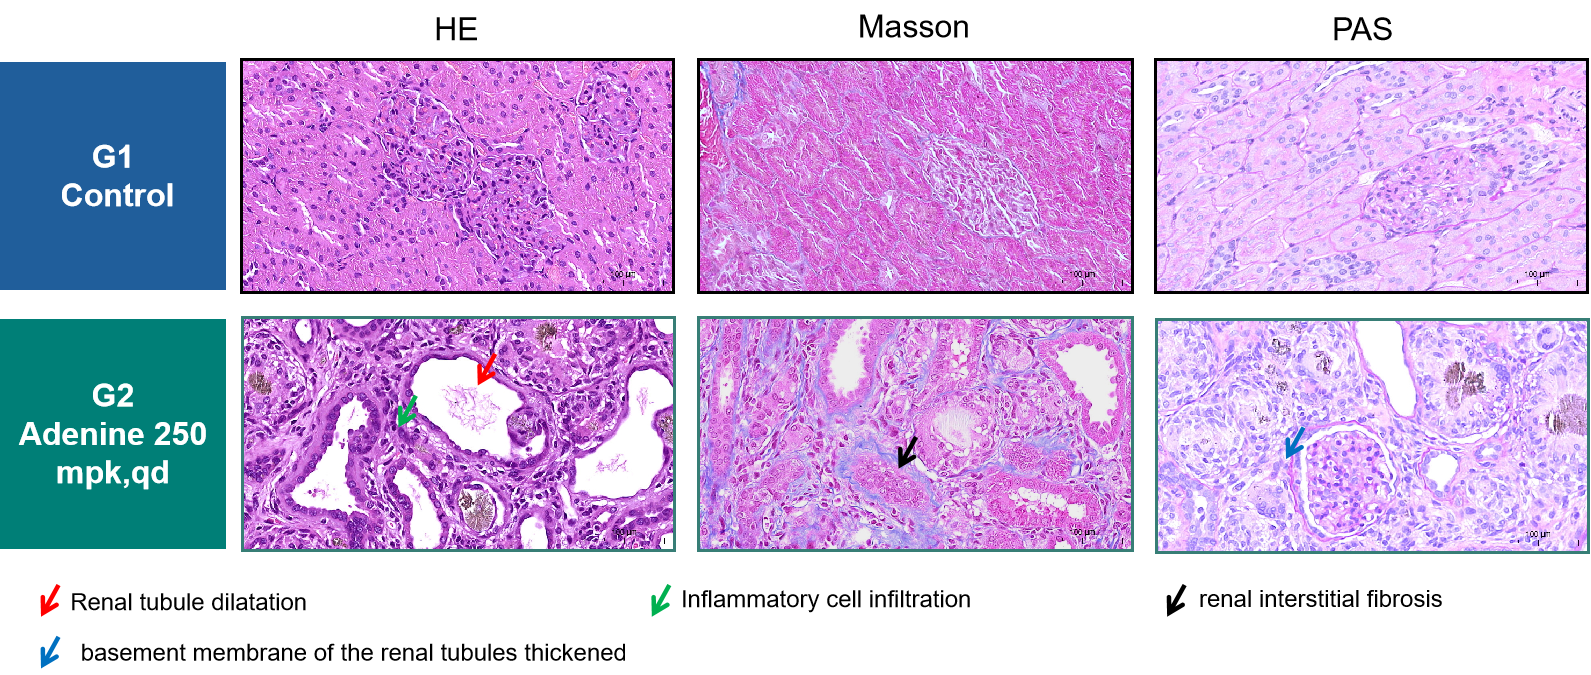
Fig.3 Histological observation of adenine-induced rat CKD model
Following induction with adenine for 9 weeks, histopathological analysis of the rat kidney demonstrated marked renal injury, characterized by diffuse inflammatory infiltrates, pronounced tubular dilation, extensive interstitial fibrosis, and irregular GBM thickening.
Pharmacodynamic evaluation EPO on adenine-induced rat CKD model
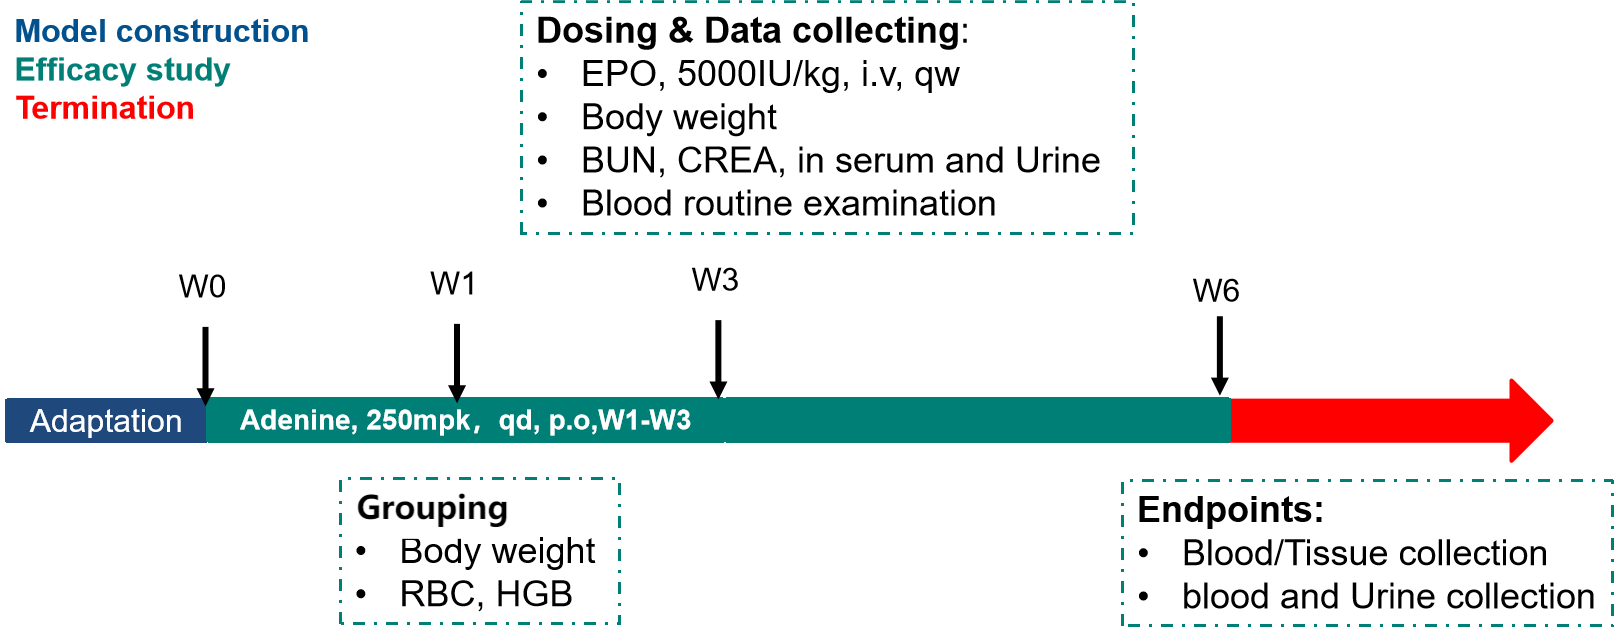
Fig.4 Overview of pharmacodynamic evaluation on adenine-induced rat CKD model
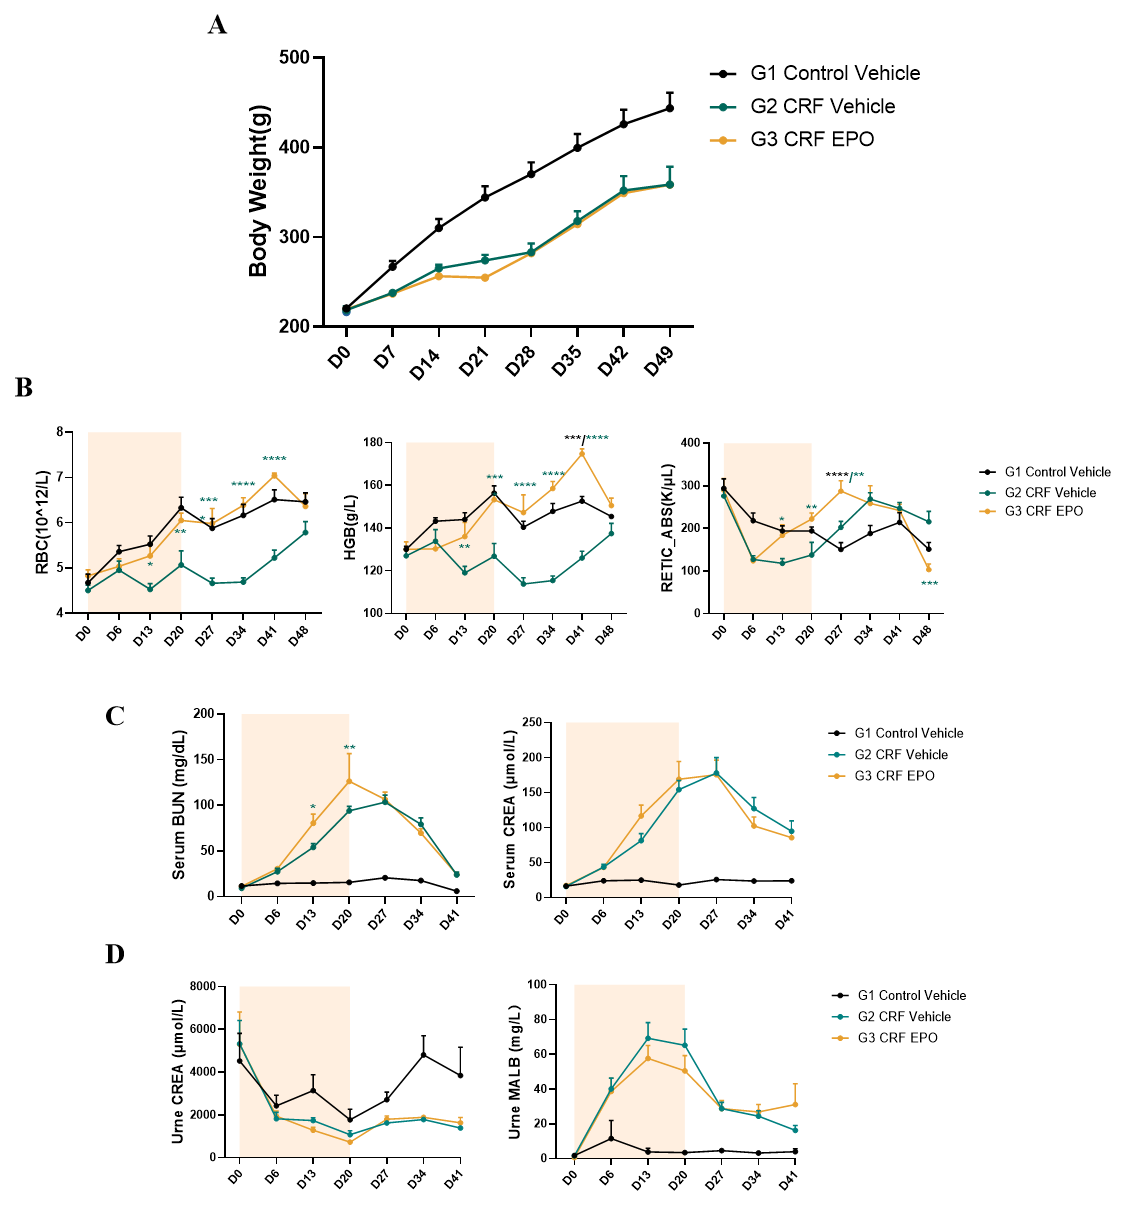
Fig.5 Pharmacodynamic evaluation EPO on adenine-induced rat CKD model
There is no significant difference in body weight between the model group and the EPO treated group (Fig. 5A). EPO administration significantly increased RBC count and HGB levels in adenine-induced CKD animals compared to untreated controls (Fig. 5B), while demonstrating no significant effects on serum and urinary creatinine and urea levels (Fig. 5C-D). Data were presented by mean ± SEM, n=8. *, p < 0.05; **, p < 0.01; ***, p < 0.001 and ****, p < 0.0001.