

Induction SLE Models
Pristane-induced SLE model
Pristane is an organic alkane extracted from mineral oil, capable of inducing lupus-like symptoms in mice when injected intraperitoneally. SLE induction using Pristane has been validated in BALB/c, B6, and DBA mouse strains.
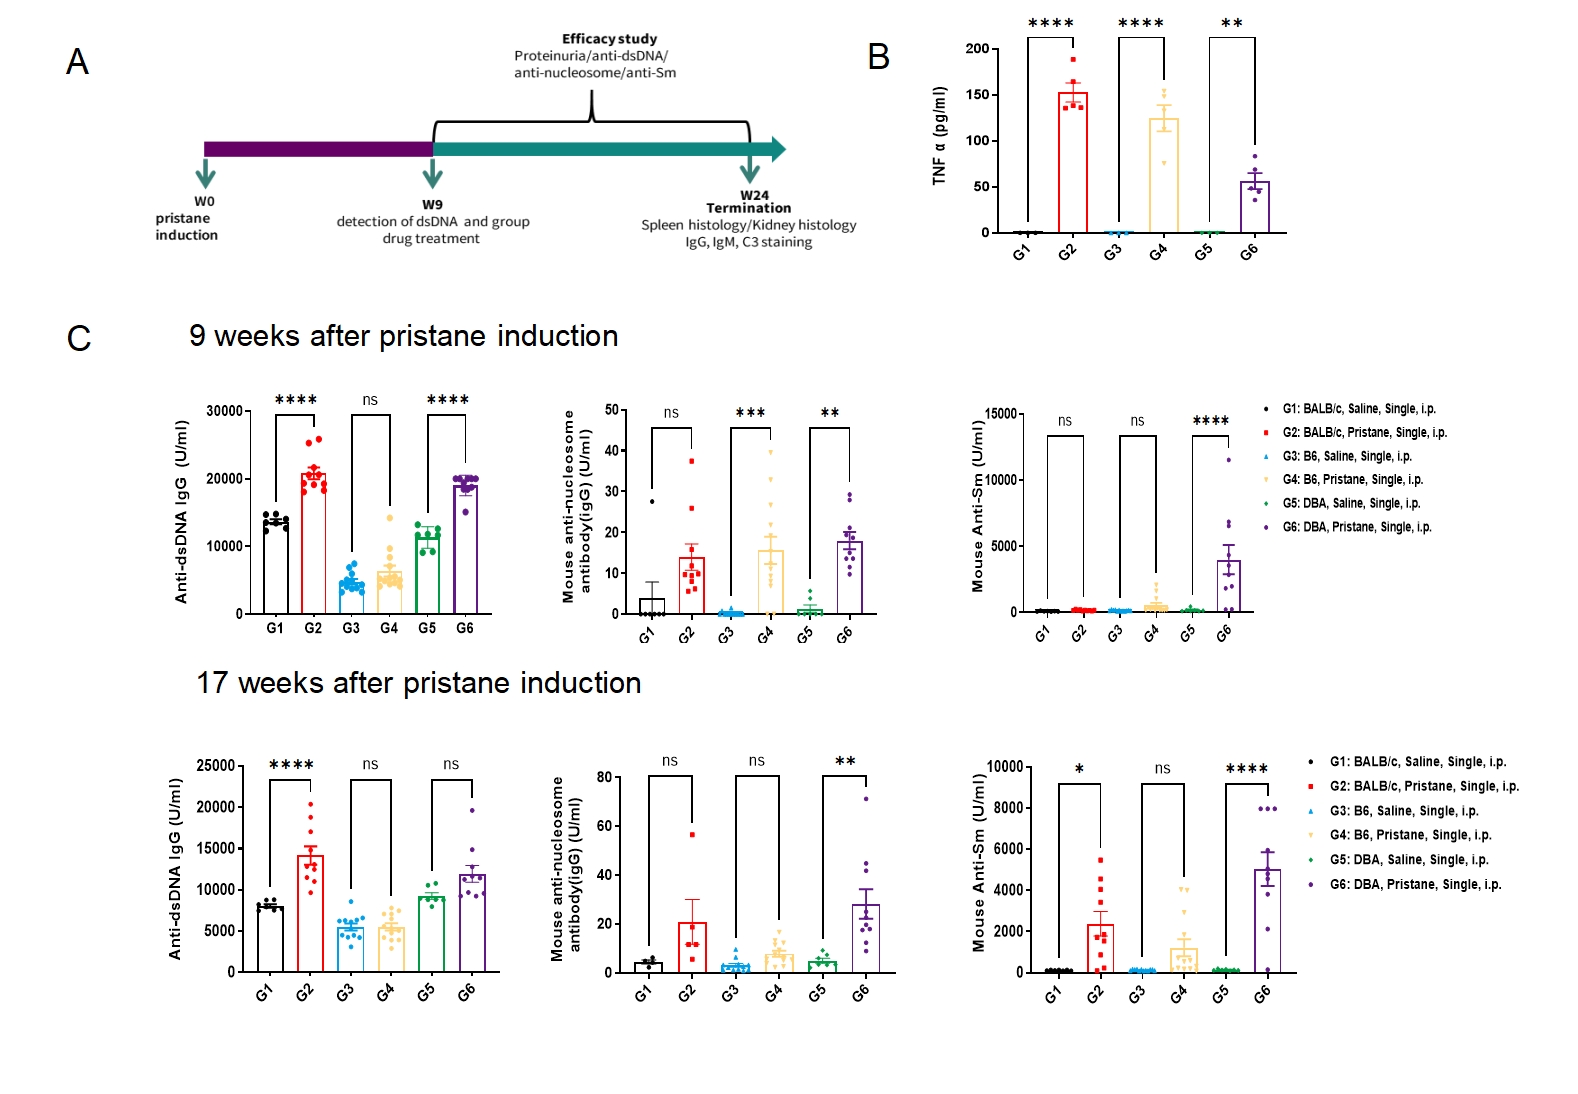
Fig.1 Pristane-induced SLE model
The experimental workflow is shown in Figure A. Five weeks after the injection of Pristane, the levels of TNFα in the peritoneal lavage fluid increased significantly (Figure B), followed by an increase in the levels of autoantibodies after 9 and 17 weeks(Figure C). Data were presented by mean ± SEM. *P<0.05,**P<0.01,***P<0.001,****P<0.0001.
TLR7 agonist-induced SLE model
The Toll-like receptor t (TLR7) agonist-induced SLE model primarily triggers immune responses through exogenous TLR7 agonists. TLR7, a pattern recognition receptor, is predominantly expressed on immune cells such as plasmacytoid dendritic cells (pDCs) and B cells. Activation of the TLR7 signaling pathway drives a type I interferon production, which activates multiple immune cell populations, including B and T cells. Activated B cells produce autoantibodies, while T cell functional alterations contribute to SLE-like autoimmune manifestations. At GemPharmatech, we offer a validated TLR7 agonist-induced SLE model, which enables rapid evaluation of drug efficacy targeting TLR7 signaling, type I interferon, B cells, or pDCs. This makes it a valuable platform in SLE drug development and therapeutic optimization identifying therapeutic candidates that inhibit immune hyperactivation, modulate autoantibody production, and ameliorate tissue damage. .
![]() Fig.2 TLR7 agonist-induced SLE model
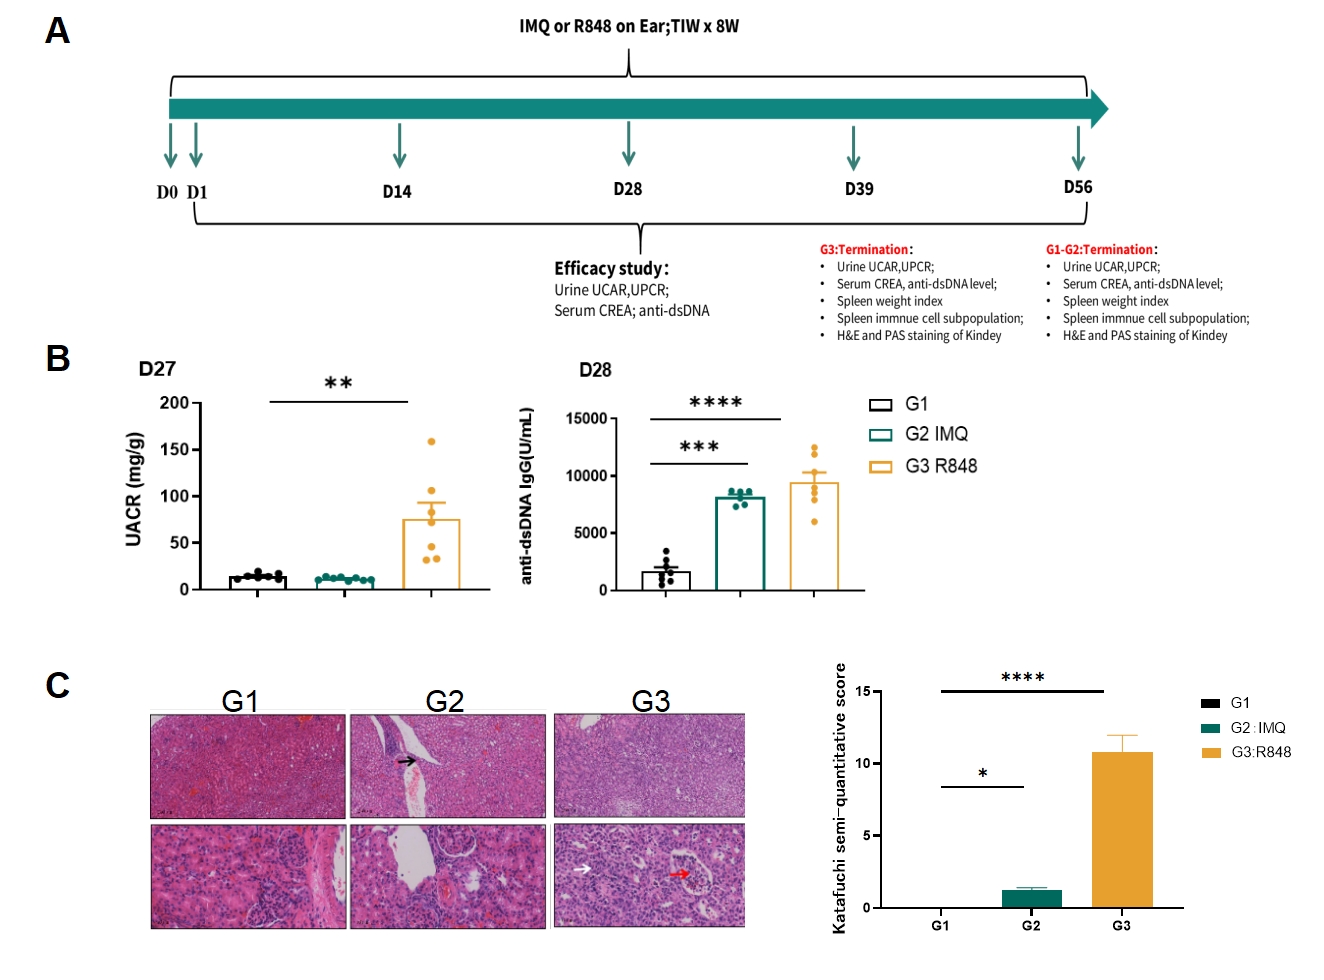
Fig.2 TLR7 agonist-induced SLE model
The experimental workflow is shown in Figure A. Urine UACR level increased significantly in R848 (Resiquimod) induction group at day 27, and serum anti-dsDNA IgG level increased significantly in both R848 and Imiquimod (IMQ)-induced mice on day 28(Figure 2B). The renal pathological data are presented in Figure 2C. The HE score of the kidney significantly increased in R848 and IMQ-induced mice. Data were presented by mean ± SEM. *P<0.05,**P<0.01,***P<0.001,****P<0.0001.