The GPT Non-Clinical Pharmacokinetics/Pharmacodynamics (PK/PD) Service Platform features a stable, well-qualified, and comprehensive service system that offers professional customized services. Leveraging a variety of technologies including ELISA, MSD, qPCR, ddPCR, flow cytometry, and LC-MS/MS, GPT has extensive experience in diverse PK/PD projects encompassing biological products (such as antibodies, fusion proteins, vaccines, cell and gene therapies), chemical medicine (including vitamins, minerals), and traditional Chinese medicines.
Service Offering
Absorption distribution metabolism excretion (ADME)
- Single/multiple administration pharmacokinetics
- Bio-availability study
- Bio-equivalence evaluation
- Drug tissue distribution
- Urine/Stool/Bile excretion test
- Plasma protein binding rate
- Drug metabolizing enzymes and transporters research
- Material balance
Immunogenicity Analysis
- Anti-drug antibody
- Neutralizing antibody
Biomarker
- Receptor occupation
- Biomarker
Toxicology (non-GLP)
- Toxicokinetics
- Long-term toxicology
- Acute toxicity
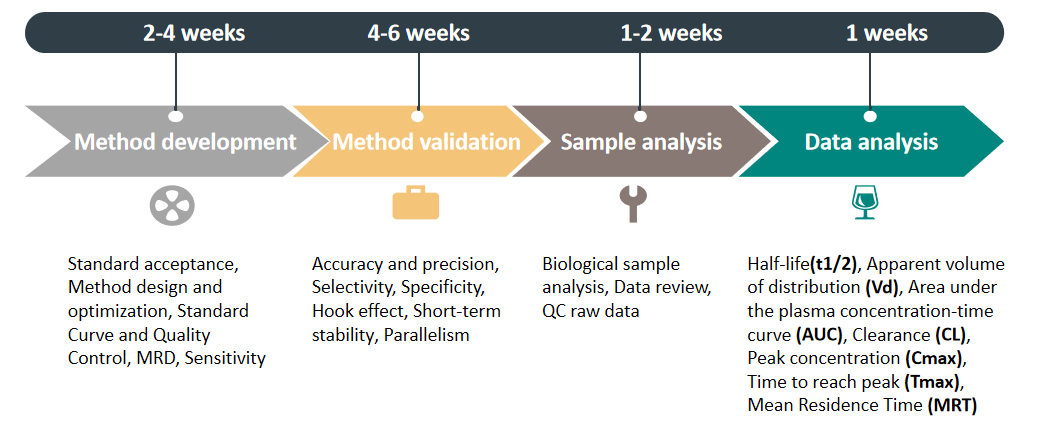
Service Process

Advantages
Capability to Analyze Multiple Drugs
Biological Product:
- Antibody, Fusion protein, Vaccine, Cell and gene therapy, etc.
Chemical Medicine:
- Vitamins, Mineral drugs, etc.; Chinese medicine.
Highly Stable Technical System
- %TE (Inter) < 25% (ICH requires less than 40%);
- %RE (Inter) ≤ ±13% (ICH requirements are within ± 25%);
- %CV (Inter) ≤ ±13% (ICH requirements are within ± 25%).
World’s leading mouse model repository
- Single target/multi-target gene humanized mouse strain 800+;
- Immune system humanized mouse strain 20+.
Case Study
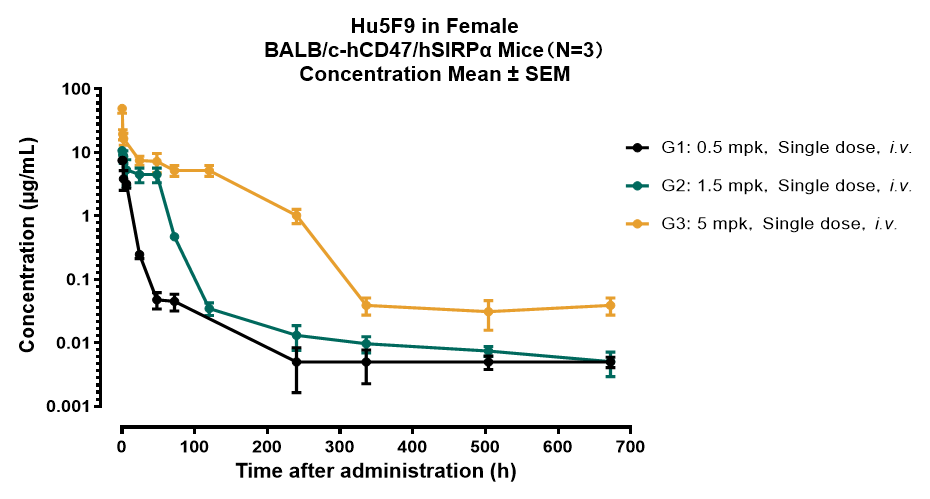
Animal: BALB/c-hCD47/hSIRPα, Female
ROA: i.v.
Method: Indirect ELISA
Lower limit of quantitation (LLOQ): 0.005 µg/mL
Blood collection cycle: 672 Hours (Day28)
Table 1. The accuracy and precision data of the standard and quality controls reflect the technical stability during method validation.
Intra/Inter | STD1 | STD2 | STD3 | STD4 | STD5 | STD6 | STD7 | QC1 | QC2 | QC3 | QC4 | QC5 |
Intra1:%RE | 2.3 | -2.6 | -7.0 | 5.4 | 6.0 | -4.8 | 0.6 | -15.2 | -10.7 | -10.8 | 0.1 | 6.2 |
Intra1:%CV | 0.1 | 11.0 | 1.5 | 1.8 | 4.1 | 1.6 | 2.4 | 8.4 | 11.1 | 2.3 | 8.9 | 3.2 |
Intra2:%RE | 0.3 | -1.6 | 3.7 | -1.6 | -0.2 | 0.5 | -0.3 | -20.7 | -13.9 | -19.7 | -5.3 | -3.2 |
Intra2:%CV | 2.6 | 17.6 | 1.3 | 1.4 | 5.1 | 0.7 | 5.7 | 10.7 | 10.6 | 9.1 | 8.1 | 9.5 |
Intra3:%RE | -0.8 | 5.8 | -9.3 | 9.7 | -6.2 | 4.0 | -1.7 | -5.9 | -14.0 | -14.6 | 4.6 | 10.1 |
Intra3:%CV | 3.2 | 2.0 | 10.0 | 2.4 | 7.8 | 3.3 | 12.8 | 7.3 | 4.5 | 5.6 | 1.5 | 5.6 |
Intra4:%RE | -3.1 | -3.8 | -4.7 | -4.4 | 16.3 | 1.6 | -8.2 | -10.3 | -6.3 | -1.5 | 4.5 | -5.0 |
Intra4:%CV | 11.2 | 3.6 | 8.2 | 16.3 | 6.4 | 2.8 | 2.4 | 8.6 | 5.8 | 13.1 | 10.6 | 8.1 |
Inter(%RE) | -2.7 | 1.7 | -2.3 | -0.8 | 3.0 | 1.9 | -3.1 | -11.6 | -13.1 | -12.2 | 3.0 | -1.7 |
Inter(%CV) | 5.5 | 8.2 | 6.8 | 8.9 | 9.8 | 4.5 | 6.1 | 9.8 | 9.1 | 12.4 | 8.0 | 9.9 |
Inter(%TE) | 8.2 | 9.9 | 9.2 | 9.7 | 12.8 | 6.4 | 9.2 | 21.4 | 22.1 | 24.6 | 10.9 | 11.6 |

Figure 1. Drug Concentrations-Time Curve in BALB/c-hCD47/hSIRPα

