

DDC-induced Primary Sclerosing Cholangitis (PSC) Model
Model Overview and Example Data
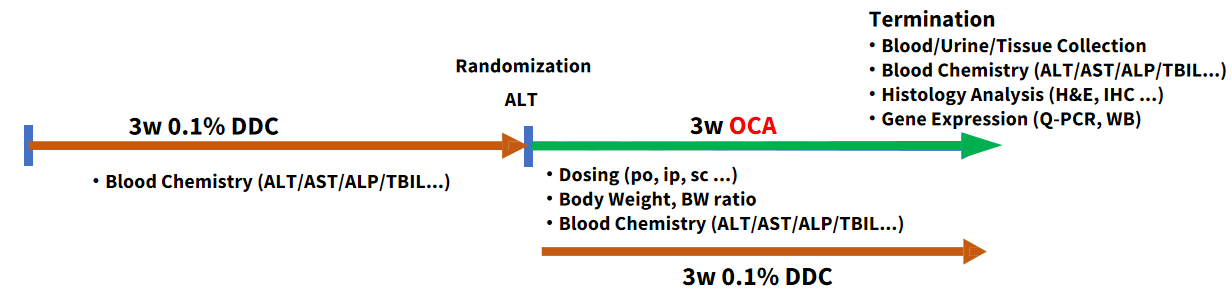
Primary sclerosing cholangitis (PSC) is a chronic cholestatic liver disease characterized by periductal fibrosis, bile duct proliferation, and inflammation, ultimately leading to cirrhosis and liver failure. The 3,5-diethoxycarbonyl-1, 4-dihydrocollidine (DDC) model is a chemically induced PSC-like mouse model that can mimic key features of human PSC. DDC primarily damages cholangiocytes (bile duct epithelial cells), activates the innate immune system, triggers inflammatory responses, and ultimately results in bile duct hyperplasia and fibrosis.
Study Outline
Model Validation Data
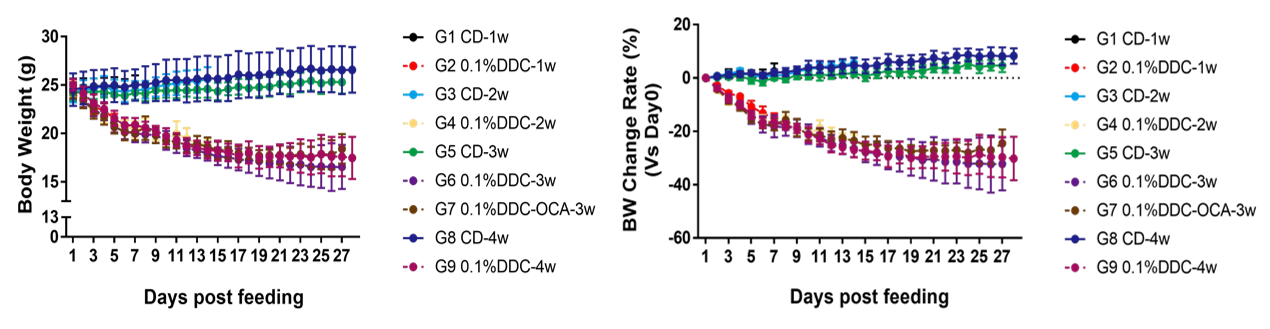
Figure 1. 0.1% DDC treatment causes loss of body weight. Data presented as Mean±SD.
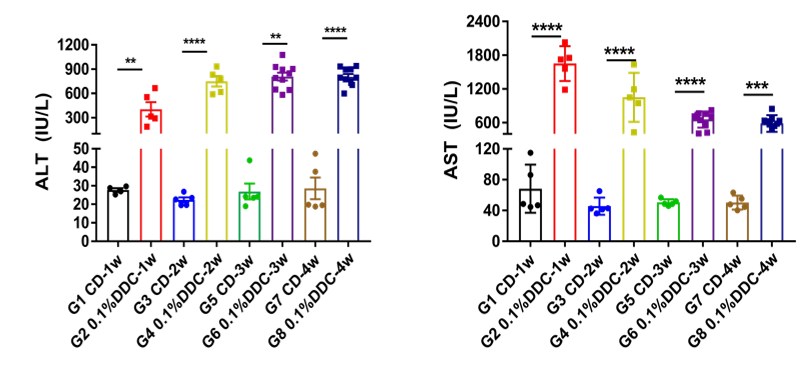
Figure 2. DDC treatment increases liver enzymes and induces liver damage.
Alanine transaminase (ALT) and aspartate transaminase (AST) levels are elevated following DDC-treatment. Data are presented as Mean±SD. *, P<0.05; **, P<0.01;***, P<0.001;****, P<0.0001 by one way ANOVA with Tukey’s post hoc test.
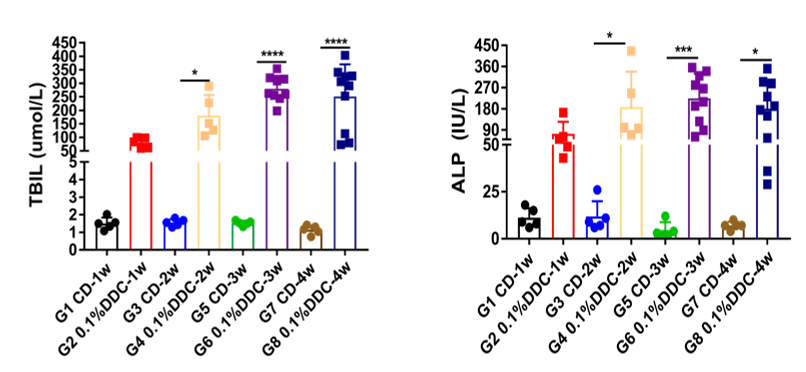
Figure 3. DDC treatment increases Bilirubin and alkaline phosphatase (ALP), causing liver damage. Data presented as Mean±SD. *, P<0.05; ****, P<0.0001 by one way ANOVA with Tukey’s post hoc test.
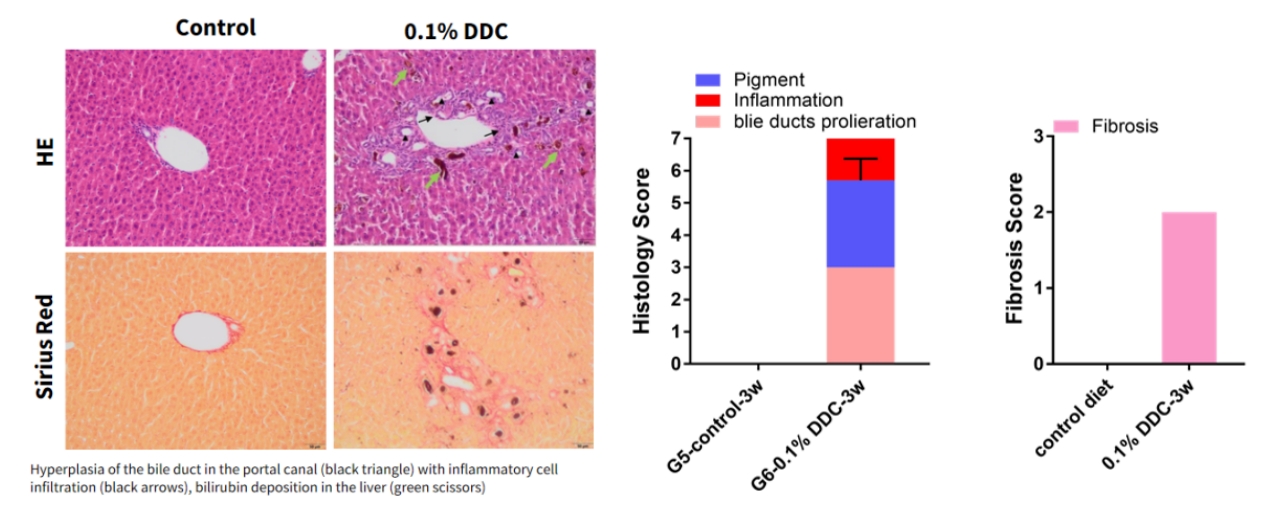
Figure 4. DDC treatment increases bile duct and cholangiocarcinoma resistance gene expression.
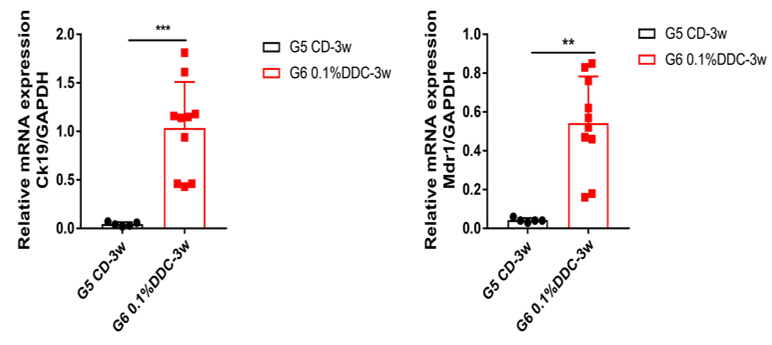
Figure 5. DDC treatment increases bile duct and cholangiocarcinoma resistance gene expression. Data presented as Mean±SD. **, P<0.01; ****, P<0.0001 by one way ANOVA with Turkey’s post hoc test.
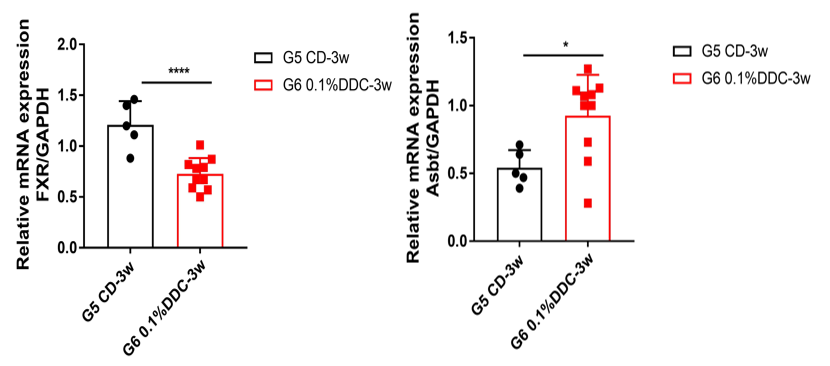
Figure 6. DDC treatment increases the uptake of bile acid by the liver and cholangiocyte. Data presented as Mean±SD. **, P<0.01; ****, P<0.0001 by one way ANOVA with Turkey’s post hoc test.
Standard of Care Drug Efficacy
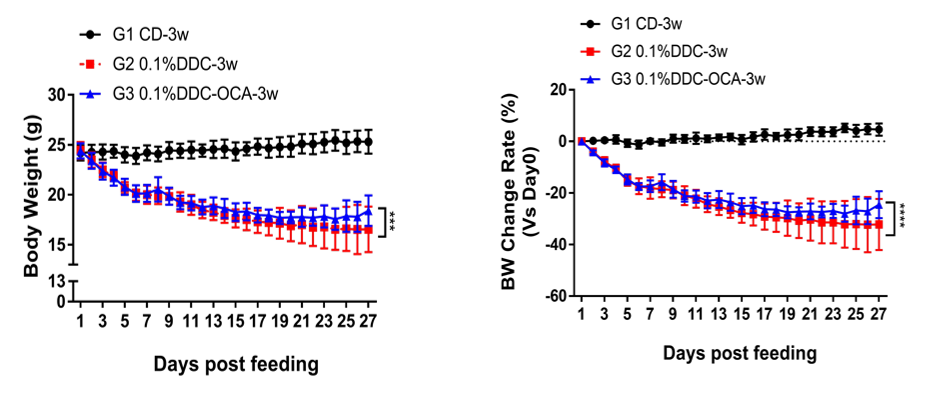
Figure 7. Obeticholic acid (OCA) moderately reduces body weight loss in PSC-treated mice. Data presented as Mean±SD. ****, P<0.0001 by one way ANOVA with Tukey’s post hoc test.
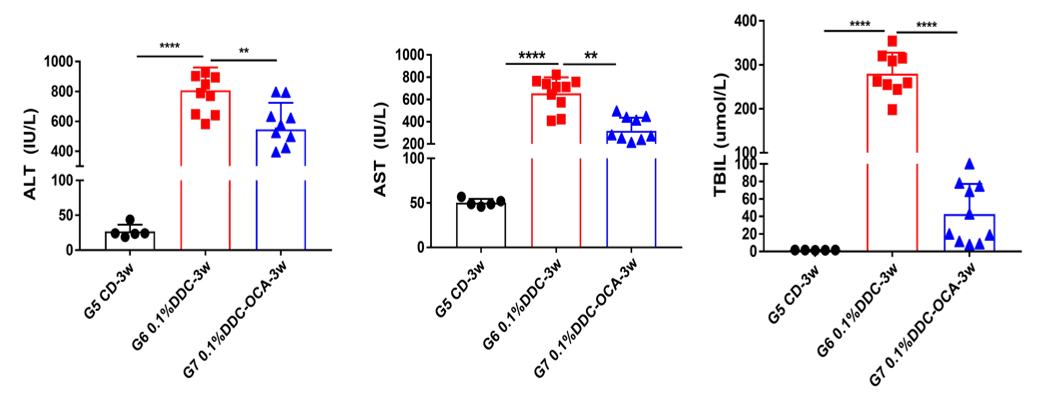
Figure 8. OCA significantly decreased liver enzyme and bilirubin, improving liver function. Data presented as Mean±SD. **, P<0.01; ****, P<0.0001 by one way ANOVA with Tukey’s post hoc test.
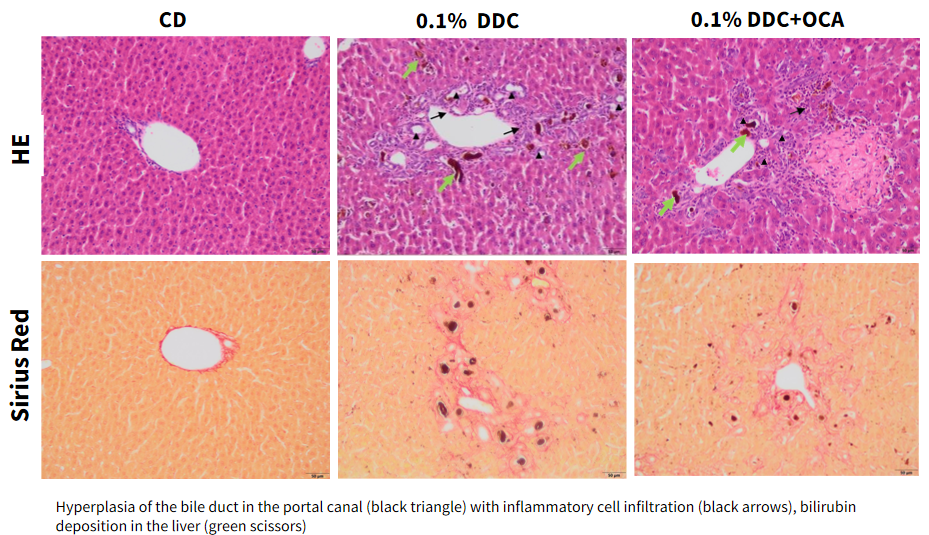
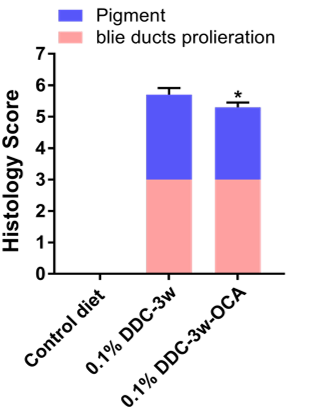
Figure 9. OCA-treatment significantly decreases deposition of bilirubin. Data presented as Mean±SD. *, P<0.05.
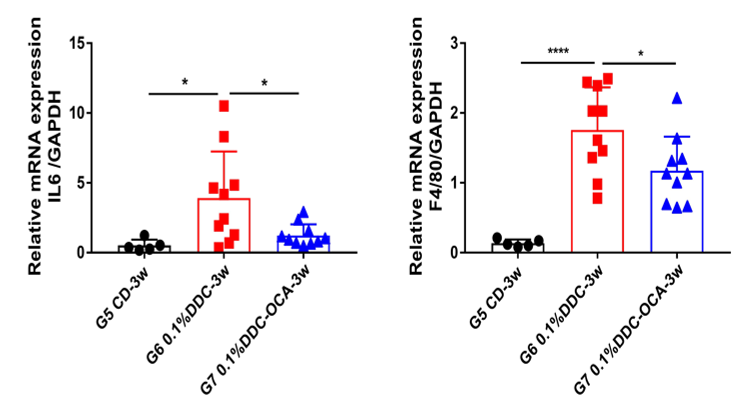
Figure 10. OCA significantly decreased inflammatory gene expression. Data presented as Mean±SD. **, P<0.01; ****, P<0.0001 by one way ANOVA with Tukey’s post hoc test.