

BKS-db MASH Models
Study Outline
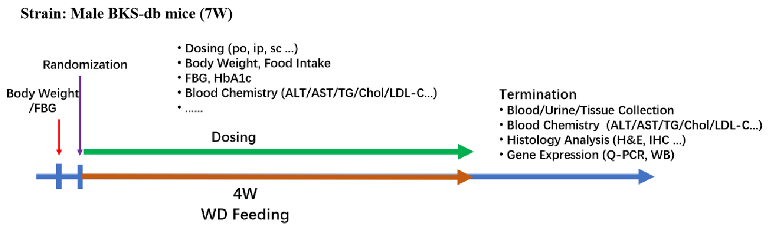
Figure 1. Overview of BKS-db mouse models.
Data Validation
1. Body Weight
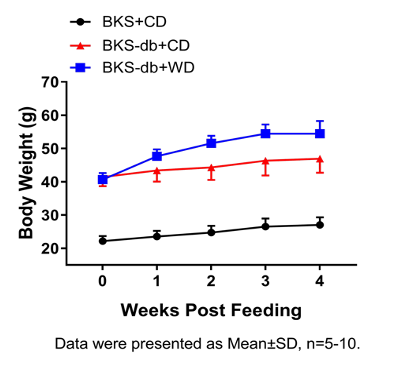
Figure 2. Weight gain in BKS-db MASH mice after WD induction. Data are presented as Mean±SD, n=5-10.
2. Blood lipid levels
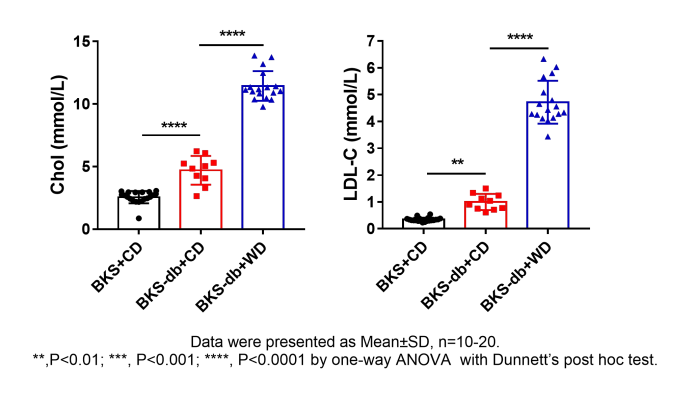
Figure 3. After 4 weeks of WD induction, BKS-db MASH mice had higher blood lipid levels than BKS-db normal diet mice. The data are shown as Mean±SD, with n=10-20. **, P<0.01; ***, P<0.001; ****, P<0.0001. by one way ANOVA with Dunnett's post hoc test.
3. Liver enzymes

Figure 4. After 4 weeks of WD induction, BKS-db MASH mice had increased liver enzyme levels compared to BKS-db mice on a normal diet.The data are shown as Mean±SD, with n=10-20. *, P<0.05; **, P<0.01; ****, P<0.0001. by one way ANOVA with Dunnett's post hoc test.
4. Liver Phenotype
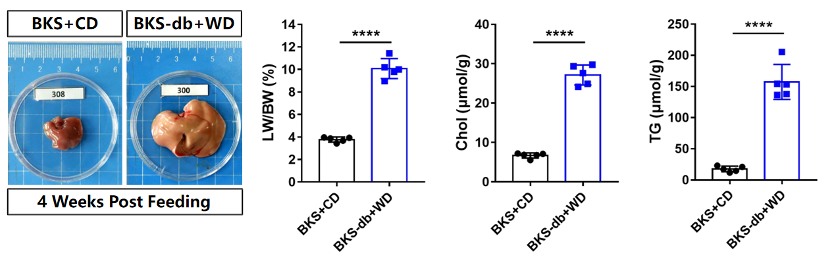
Figure 5. After 4 weeks of WD induction, BKS-db MASH mice developed a severe fatty liver phenotype. The data are shown as Mean±SD, n=5. ****,P<0.0001; by unpaired t test.
5. Histopathology
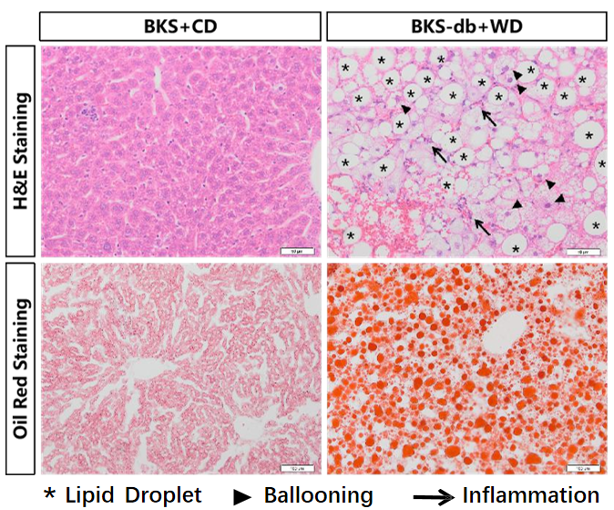
Figure 6. BKS-db MASH mice showed a more severe inflammatory phenotype, including lipid accumulation and cellular vacuole-like lesions, after 4 weeks of WD induction.
6. Expression of inflammation, fibrosis-related biomarkers
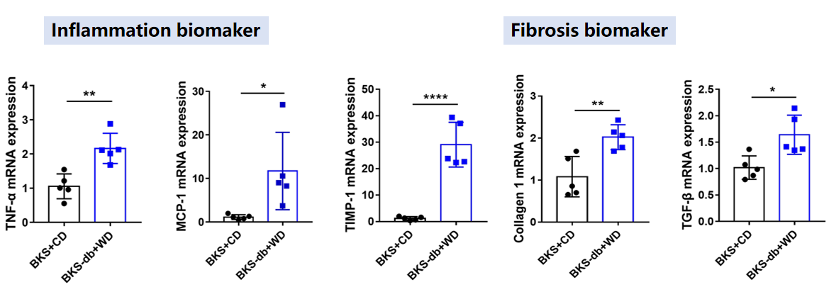
Figure 7. After 4 weeks of WD induction, the expression levels of inflammation, fibrosis-related biomarkers were raised in BKS-db MASH mice. The data are shown as Mean±SD, n=5. *,P<0.05;**,P<0.01;****,P<0.0001; by unpaired t test.
Efficacy data
1. Body Weight
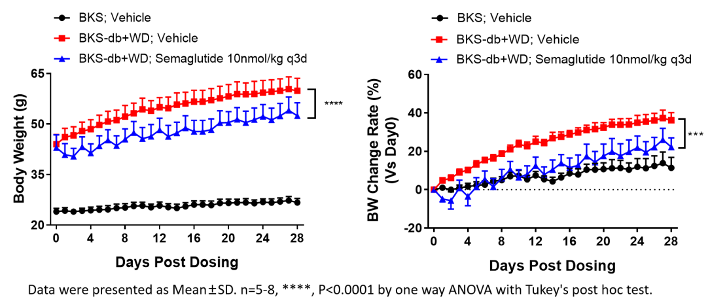
Figure 8. Semaglutide significantly reduced the body weight and body weight change rate in BKS-db MASH model. Data are presented as Mean±SD. ***, p<0.001by one way ANOVA with Tukey's post hoc test.
2. Fasting Blood Glucose

Figure 9. Semaglutide significantly reduced fasting glucose in the BKS-db MASH model. Data are presented as Mean±SD, n=5~10. ****, P<0.0001 by one-way ANOVA with Tukey's post hoc test.
3. Liver function
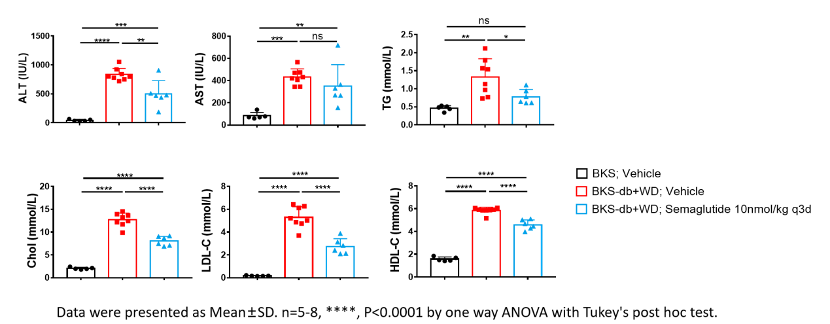
Figure 10. Semaglutide Significantly Improved Liver Function and Dyslipidemia in BKS-db MASH Model. Data are presented as Mean±SD, n=5-10. ****, P<0.0001 by one-way ANOVA with Tukey's post hoc test.
4. Liver weight
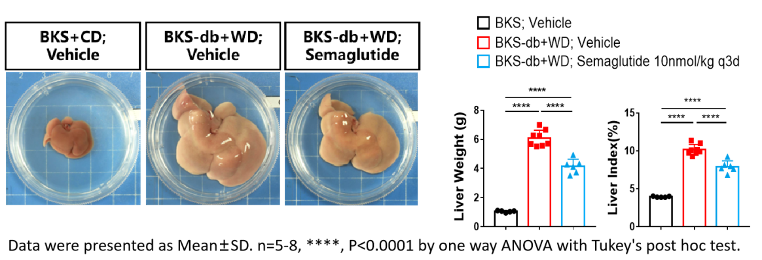
Figure 11. Semaglutide significantly reduced liver weight and the liver to body weight ratio in BKS-db MASH model. Data are presented as Mean±SD, n=5~8. ****, P<0.0001 by one-way ANOVA with Tukey's post hoc test.
5. Histopathology
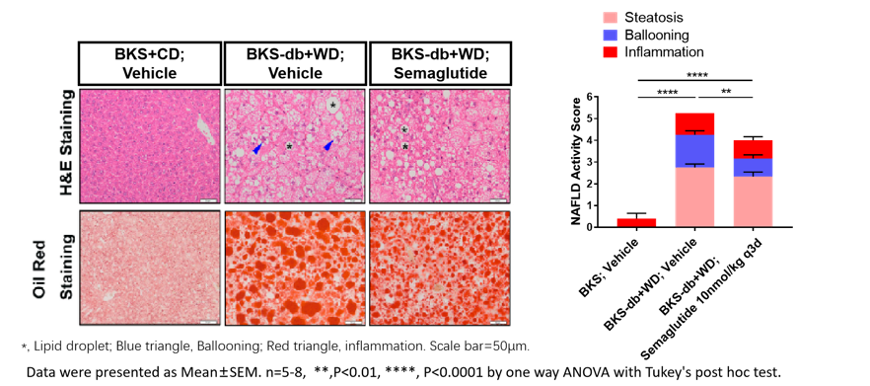
Figure 12. Semaglutide significantly improved the hepatic steatosis, inflammation and ballooning in BKS-db MASH mode. Data were presented as Mean±SD, n=5~8. ****, P<0.0001 by one-way ANOVA with Tukey's post hoc test.