45% HFHSD Induced Obesity(DIO) models

Study Outline

Fig1.png


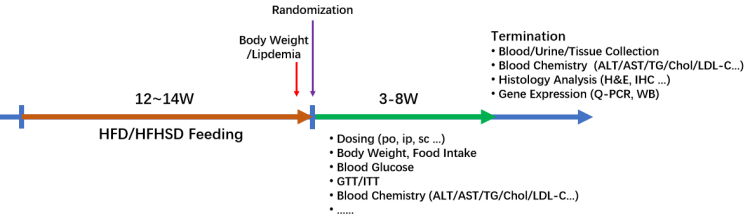
Figure 1. HFD: 60% high-fat diet; HFHSD: 45% high-fat, high-sugar diet. Experimental period: 12-20 weeks.


Data validation

1. Body weight curve

Fig2.png

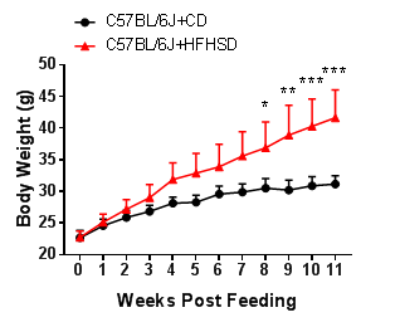
Figure 2. The body weight of C57BL/6 mice increased significantly after feeding with 45% HFHSD.Data are presented as Mean±SD.*, p<0.05;**, p<0.01;***, p<0.001 by unpaired two-tailed Student's t-test.


2. Postprandial blood glucose

Fig3.png

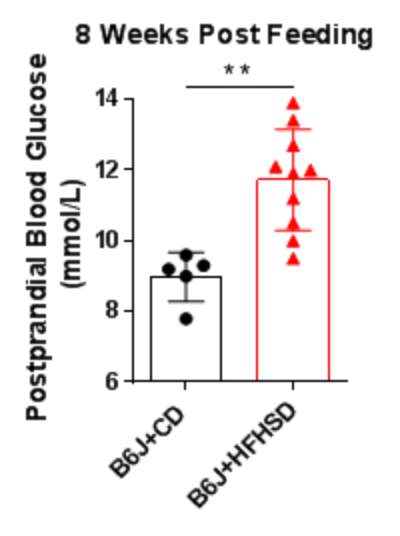
Figure 3. The postprandial blood glucose of C57BL/6 mice increased significantly after feeding with 45% HFHSD for 8 weeks. Data are presented as Mean±SD.**, p<0.01; by unpaired two-tailed Student's t-test.


3. Blood lipid levels

Fig4.png

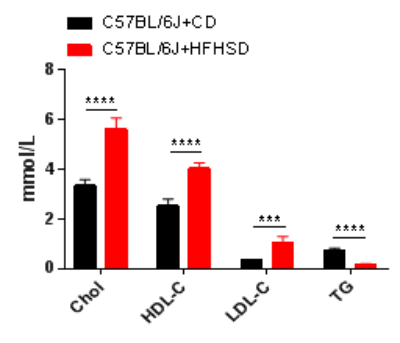
Figure 4. The plasma cholesterol and triglyceride levels of C57BL/6 mice increased significantly after feeding with 45% HFHSD for 8 weeks. Data are presented as Mean±SD.***, p<0.001****, p<0.0001 by unpaired two-tailed Student's t-test.


TALK WITH OUR EXPERTS

GemPharmatech is committed to protecting and respecting your privacy, and we'll only use your personal information to administer your account and to provide the products and services you requested from us. From time to time, we would like to contact you about our products and services, as well as other content that may be of interest to you. If you consent to us contacting you for this purpose, please click below to say how you would like us to contact you:

In order to provide you with the content requested, we need to store and process your personal data. If you consent to us storing your personal data for this purpose, please click the checkbox below.

You can unsubscribe from these communications at any time. For more information on how to unsubscribe, our privacy practices, and how we are committed to protecting and respecting your privacy, please review our Privacy Policy.