
Beyond the Eosinophilic Paradigm: Mechanism-Driven Selection of Mouse Models in Asthma Research



Asthma affects more than 300 million people worldwide and remains one of the most complex chronic inflammatory disorders of the airways. Clinically, it presents a characteristic triad of bronchoconstriction, airway inflammation, and mucus hypersecretion, leading to symptoms ranging from nocturnal cough to severe dyspnea and wheezing.
While the pathogenesis involves a complex interplay of immune hyper-responsiveness and airway remodeling, the therapeutic landscape has long been dominated by targeting type 2 (T2) inflammatory axis (IL-4/5/13). However, the reality is that asthma is not a single disease. This has led to a critical shift in drug development: moving from a one-size-fits-all approach to a mechanism-based strategy that acknowledges the profound differences between T2 and non-T2 endotypes.
The classification of asthma into T2 (eosinophilic) and non-T2 (mixed granulocytic or neutrophil-dominant) is no longer just an academic exercise; it is the cornerstone of modern drug discovery. While T2 asthma is well-served by corticosteroids and biologics like Dupilumab, non-T2 asthma represents a massive unmet need (Table 1). Patients with non-T2 asthma are often insensitive to steroids and currently have few drug options other than Tezepelumab, the first biologic approved for asthma independent of T2 biomarkers. Promising clinical data for non-T2 asthma candidates like Astegolimab (anti-ST2) and Itepekimab (anti-IL-33) have shown significant efficacy in low-eosinophil populations, but this clinical progress creates an urgent preclinical challenge. Our data clearly show that therapeutic responses differ drastically between different preclinical asthma models. For instance, a standard OVA-induced mouse model is highly responsive to glucocorticoids, whereas an HDM+LPS-induced mouse model, characterized by neutrophilic infiltration, is profoundly resistant to glucocorticoids (Figure 1). Bridging the gap between bench research and these emerging non-T2 clinical outcomes requires a new generation of animal models that faithfully recapitulate the unique biology of non-eosinophilic asthma.
Table 1. The classification of asthma
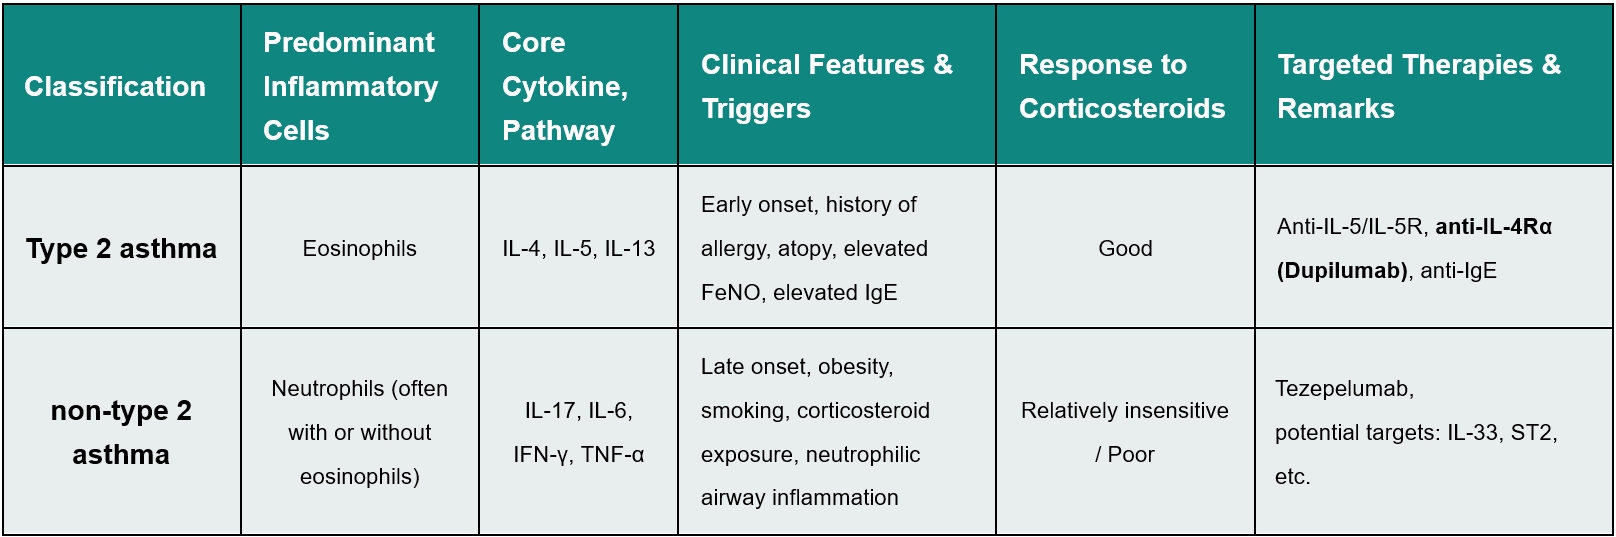
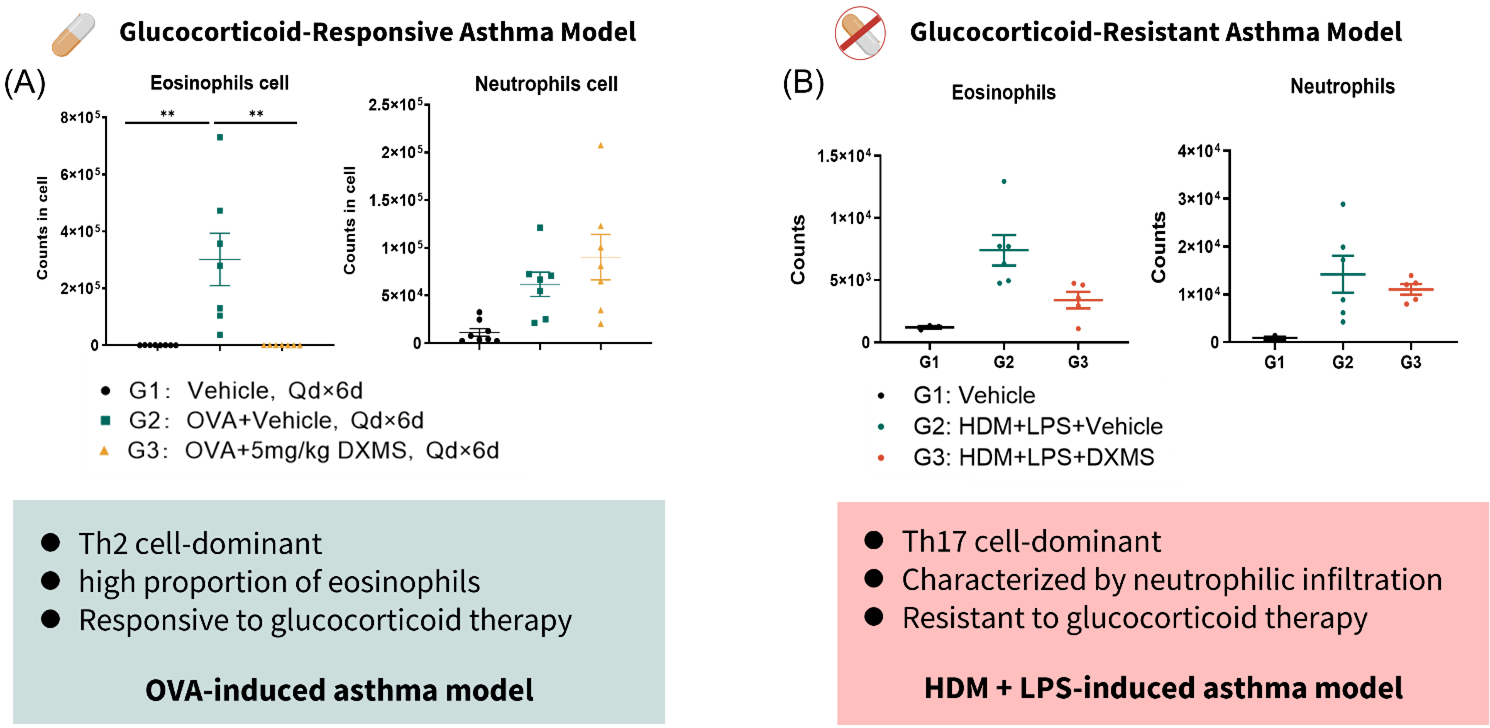
Figure 1. Glucocorticoid response differences in type 2 and non-type 2 asthma models
(A) FACS analysis of BALF in OVA-induced asthma model. (B) FACS analysis of BALF in HDM+LPS-induced asthma model. Data are expressed as mean ± SEM, n=3-8. Statistics performed using One-way ANOVA. *, P < 0.05; **, P < 0.01; ***, P < 0.001; ****, P < 0.0001.
To empower precise, mechanism-of-action (MoA) driven drug discovery, GemPharmatech has developed a comprehensive asthma model matrix. We categorize our models based on two key clinical parameters: responsiveness to glucocorticoids and predominant immune cell infiltration. This matrix allows you to strategically select the most suitable model based on your drug’s MoA. For developers of a follow-on therapeutic targeting T2 asthma, benchmarking against Dupilumab's near-perfect efficacy in our HDM model is the recommended approach. For those targeting the unmet non-T2 space, our steroid-resistant, neutrophil-dominant asthma models provide a clinically relevant platform to demonstrate true differentiation.
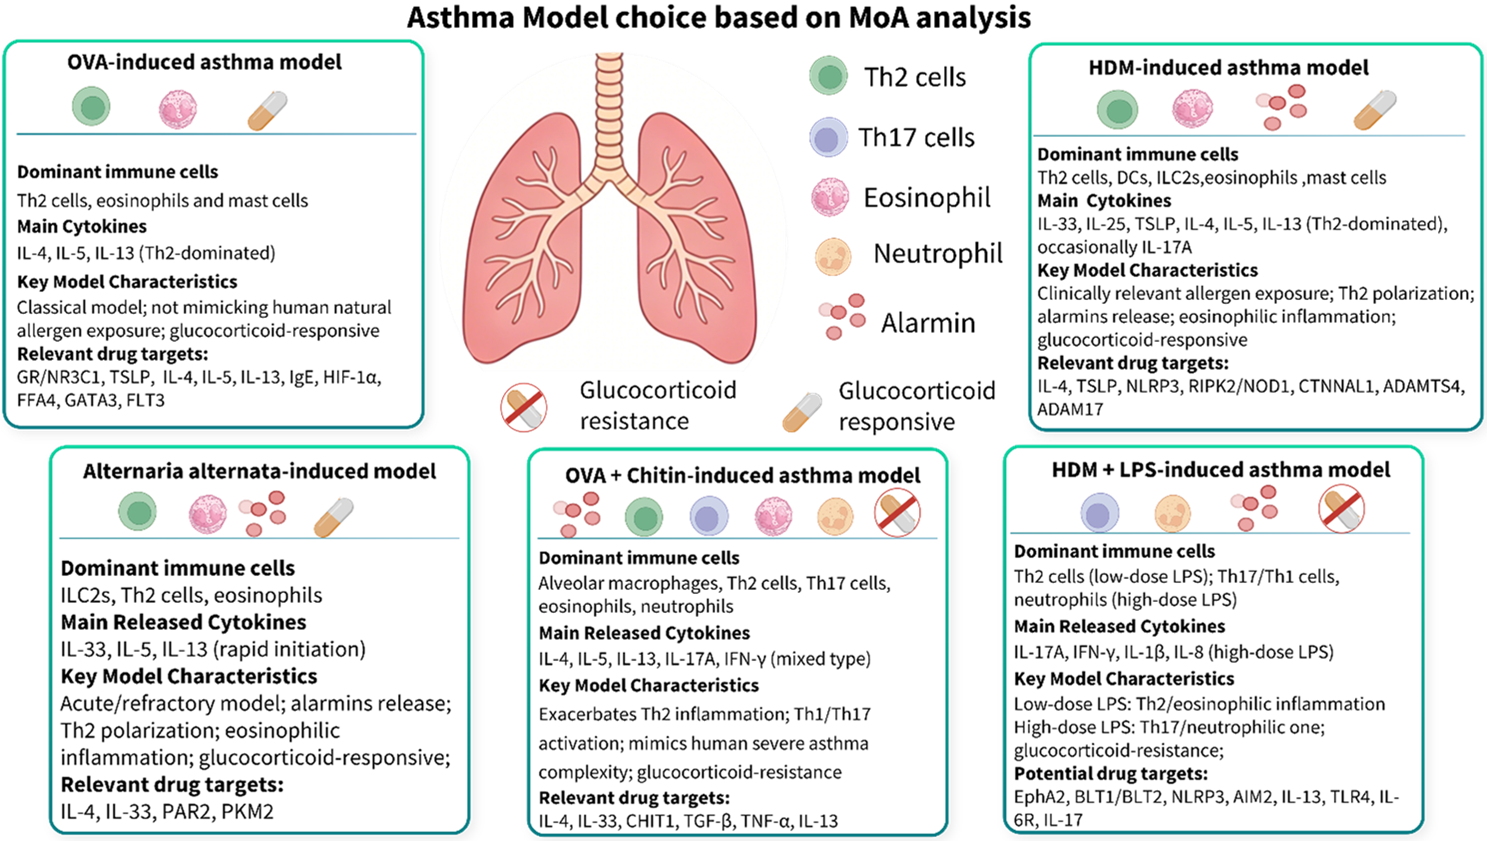
Figure 2. Asthma model choice based on MoA analysis
In MoA-driven drug discovery, model-dependent efficacy is the most critical insight for asthma drug development. To illustrate, we performed a parallel study comparing the response to an anti-mouse IL-4RA antibody or Dupilumab across our T2 (HDM) and non-T2 (Alternaria alternata-induced; HDM+LPS-induced) asthma models (Figure 3, 4, 5). The results are striking and directly mirror clinical realities:
In the classic T2 asthma model (HDM-induced), Dupilumab or anti-mouse IL-4RA treatment significantly inhibited hallmark T2 asthma pathologies. We observed a marked reduction in BALF eosinophils, and downregulation of key Th2 cytokines (IL-5, IL-33) at protein levels in the lung. Histological examination confirmed significantly reduced airway inflammation and epithelial thickening. These data establish the well-known "Dupilumab Wall”, a near-perfect efficacy ceiling that new T2 asthma targeted candidates will struggle to surpass.
In striking contrast, in non-T2 asthma models (Alternaria alternata and HDM+LPS), anti-mouse IL-4RA treatment failed to suppress the dominant immune drivers (eosinophils and neutrophils) in BALF. More importantly, lung cytokine analysis revealed that anti-mouse IL-4RA did not reduce IL-5 or IL-33 levels—key drivers of inflammation in mixed/neutrophilic asthma models. In addition, anti-mouse IL-33 treatment, rather than anti-mouse IL-4RA treatment, significantly inhibited lung IL-5 levels in the Alternaria alternata-induced asthma model. Histology confirmed the limited efficacy of anti-mouse IL-4RA treatment in non-type 2 asthma models.
The head-to-head comparison delivers a clear message: the immune cell landscape dictates drug response. A therapeutic that is highly effective in an eosinophil-driven model can be completely ineffective in a mixed or neutrophil-driven model. This aligns perfectly with clinical observations where non-T2 asthma patients do not benefit from anti-mouse IL-4RA therapy. Therefore, selecting a model whose granulocytic profile matches the drug's target mechanism is not just important, it is essential for translational success.
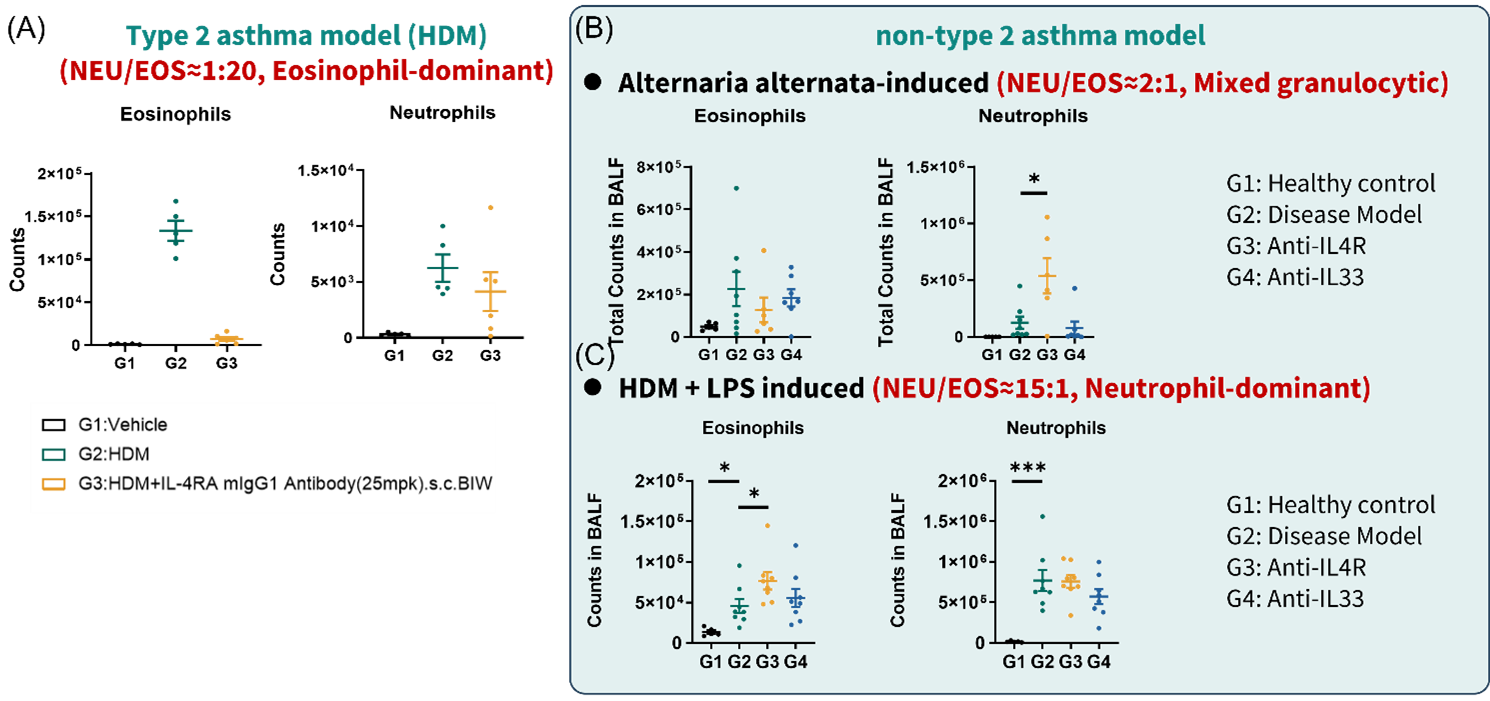
Figure 3. Anti-mouse IL-4RA failed to inhibit BALF eosinophils in non-T2 asthma models
(A) eosinophils and neutrophils quantification of BALF FACS in HDM induced asthma model. (B) eosinophils and neutrophils quantification of BALF FACS in Alternaria alternata-induced asthma model. (C) eosinophils and neutrophils quantification of BALF FACS in HDM + LPS induced asthma model. Data are expressed as mean ± SEM, n=5-8. Statistics performed using One-way ANOVA. *, P < 0.05; **, P < 0.01; ***, P < 0.001; ****, P < 0.0001.
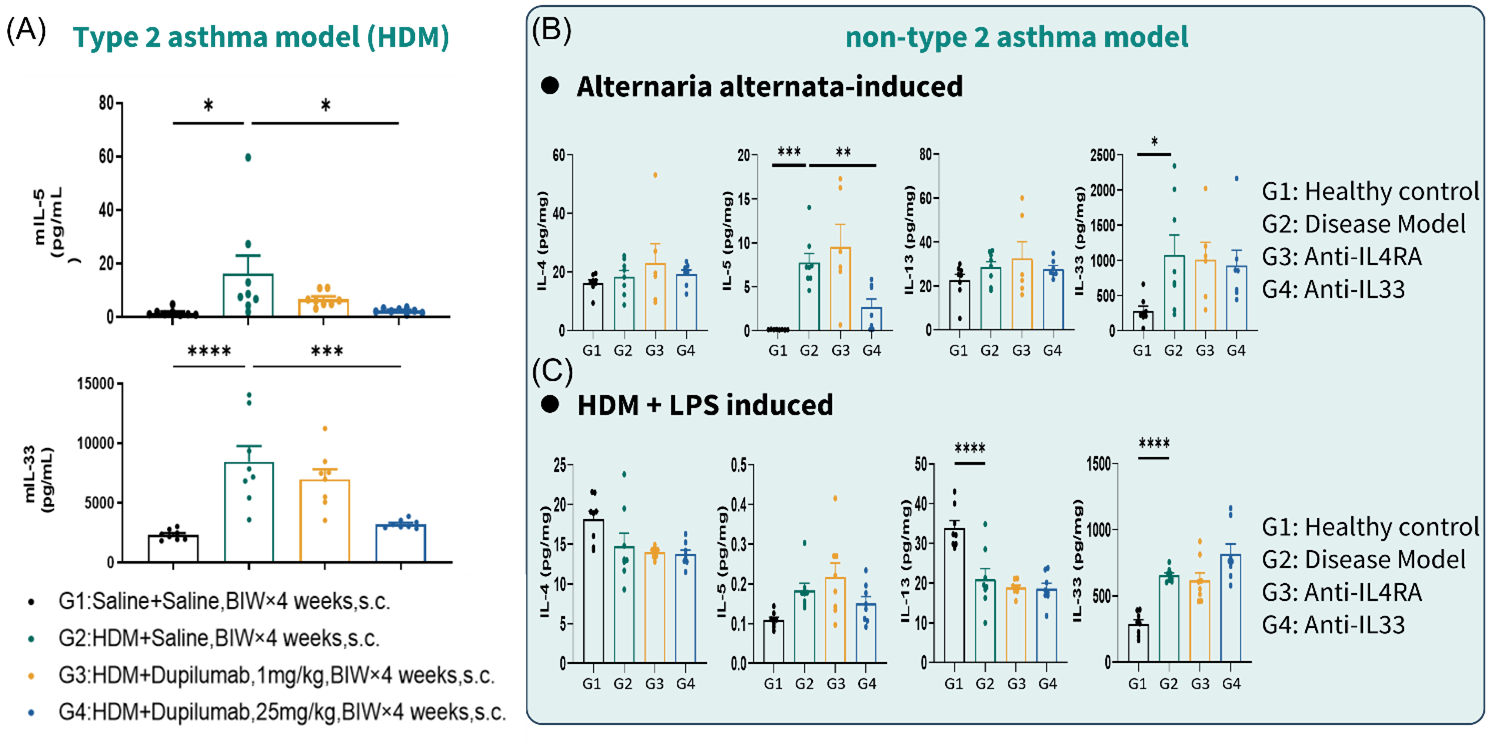
Figure 4. Anti-mouse IL-4RA failed to inhibit lung IL-5 and IL-33 in non-T2 asthma models
(A) lung cytokine (IL-5, IL-33) quantification in HDM induced asthma model. (B) lung cytokine (IL-4, IL-5, IL-13, IL-33) quantification in Alternaria alternata-induced asthma model. (C) lung cytokine (IL-4, IL-5, IL-13, IL-33) quantification in HDM + LPS induced asthma model. Data are expressed as mean ± SEM, n=5-8. Statistics performed using One-way ANOVA. *, P < 0.05; **, P < 0.01; ***, P < 0.001; ****, P < 0.0001.
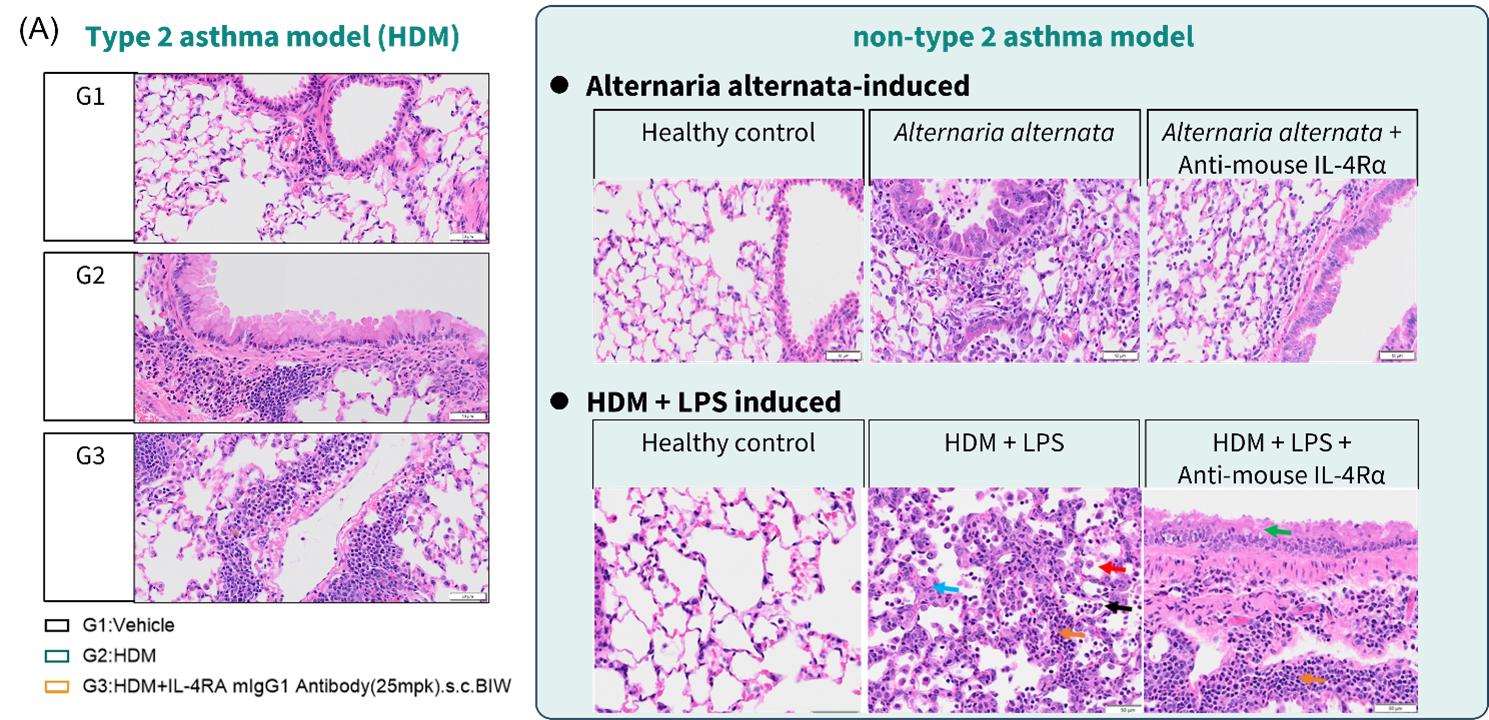
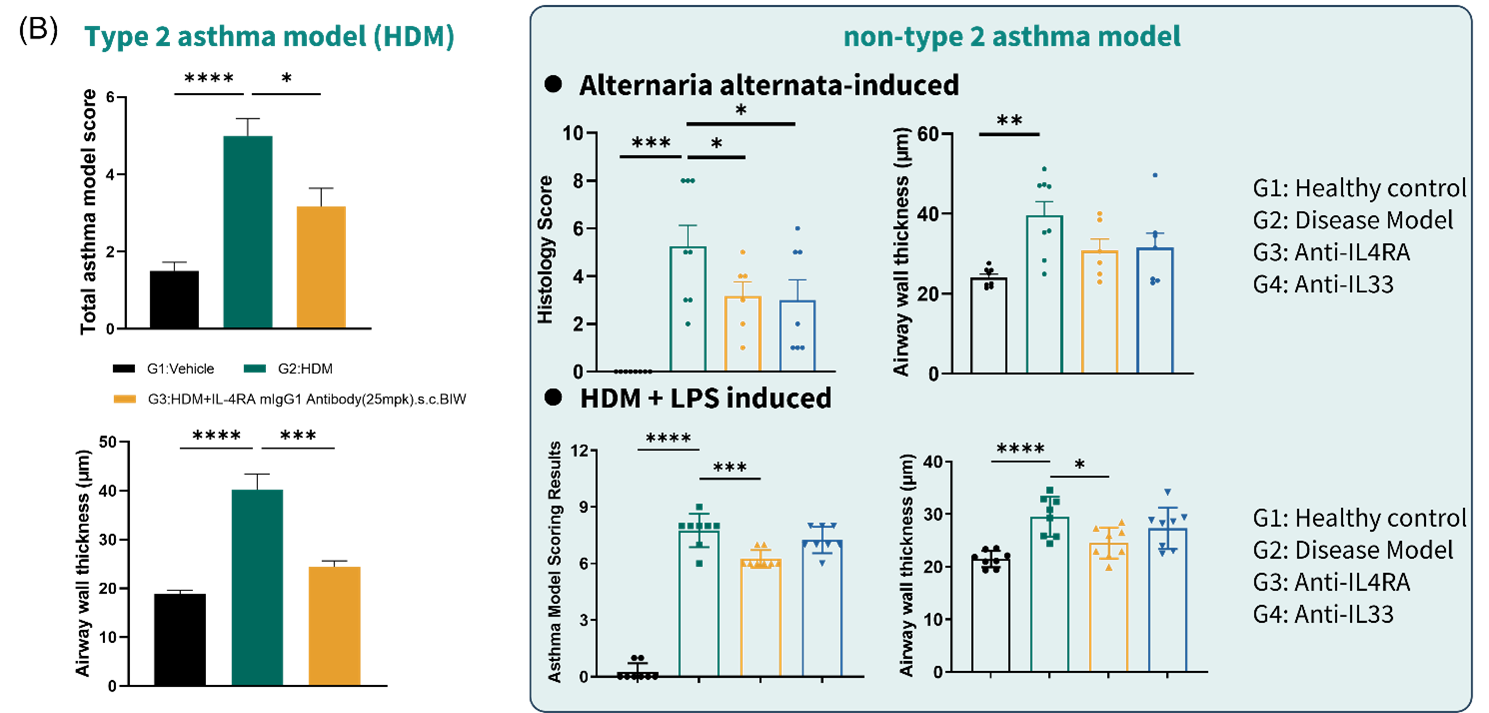
Figure 5. Anti-mouse IL-4RA exerted limited efficacy in histology of non-T2 asthma models
(A) representative lung H&E staining images in HDM induced, Alternaria alternata-induced, and HDM + LPS induced asthma model. (B) histological examination results in HDM induced, Alternaria alternata-induced, and HDM + LPS induced asthma model. Data are expressed as mean ± SEM, n=5-8. Statistics performed using One-way ANOVA. *, P < 0.05; **, P < 0.01; ***, P < 0.001; ****, P < 0.0001.
Summary: GemPharmatech’s asthma model portfolio
Figure 6 summarizes the key characteristics of our five core asthma models, providing a quick reference to guide your MoA-based model selection. Use this matrix to match your drug's mechanism – whether it targets T2 cytokines (IL-4/5/13), alarmins (IL-33/TSLP), or downstream effectors – to the model with the corresponding granulocytic and cytokine profile. This head-to-head comparison empowers you to de-risk your program and generates clinically translatable efficacy data from the start.
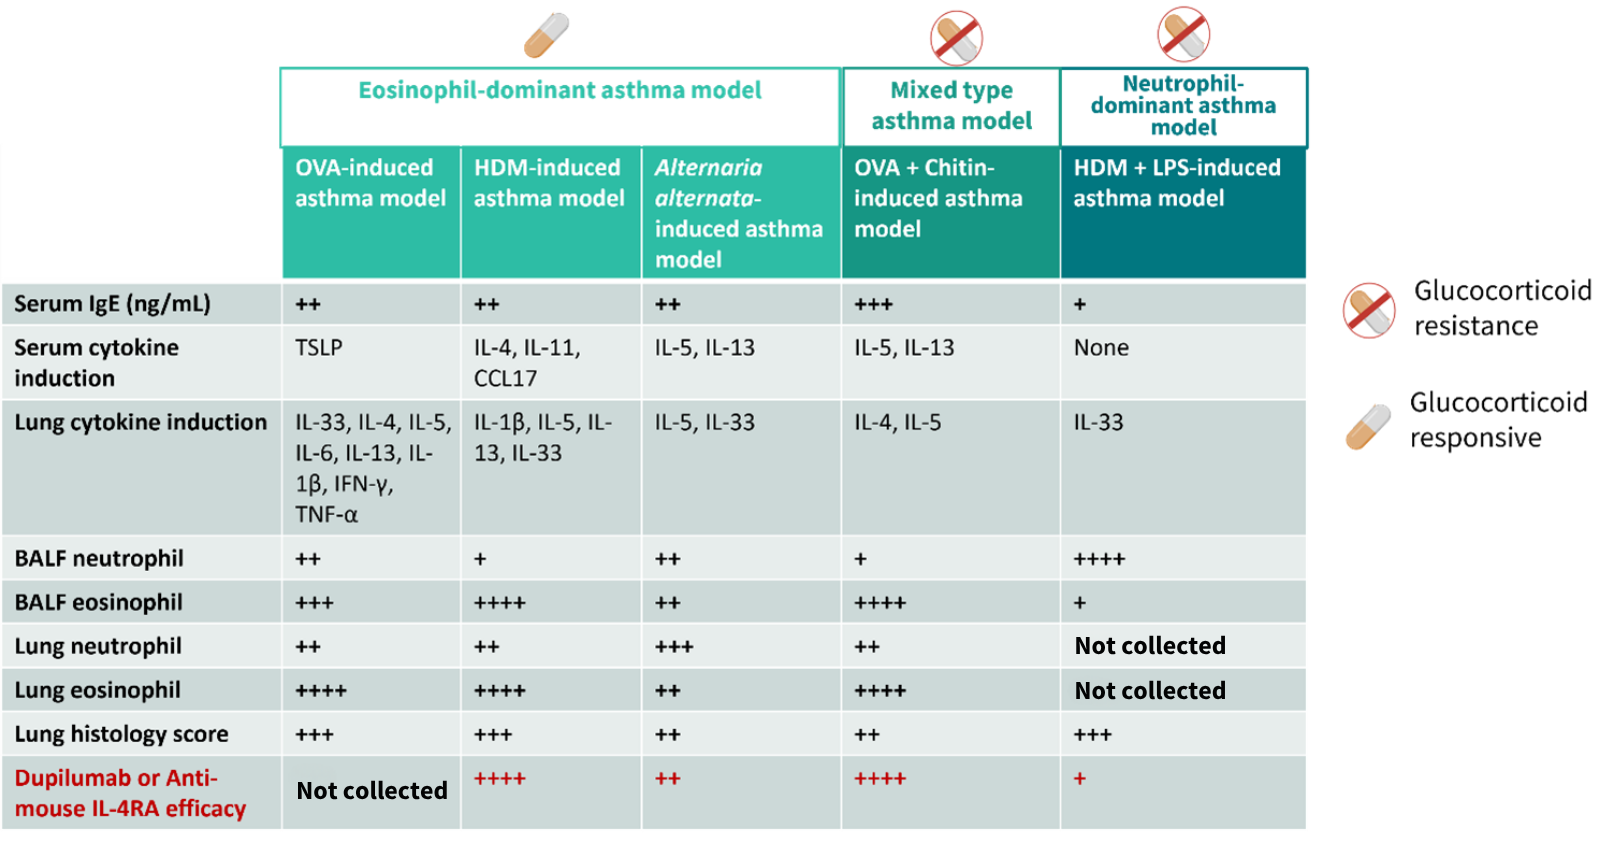
Figure 6. Comparison summary of asthma mouse models of GemPharmatech