
TCE In Vitro Evaluation Platform: Comprehensive Assessment from Target Engagement to Tumor Cell Killing


Bispecific T-cell engagers (TCEs) are engineered antibodies that simultaneously bind tumor-associated antigens (TAAs) on tumor cells and the CD3 receptor on T-cells to direct potent cytotoxic responses against cancer cells. At GemPharmatech, we have established a comprehensive in vitro platform to support development of TCE-based therapies from evaluating binding efficiency to functional activation, and immune cell mediated killing across multiple assay formats.
Tarlatamab, a bispecific T-cell engager (TCE), is designed to target DLL3 (a Notch ligand expressed in small cell lung cancer [SCLC] cells) and the CD3 complex on T-cells. GemPharmatech exemplifies its preclinical in vitro characterization through the following assays.
![]()
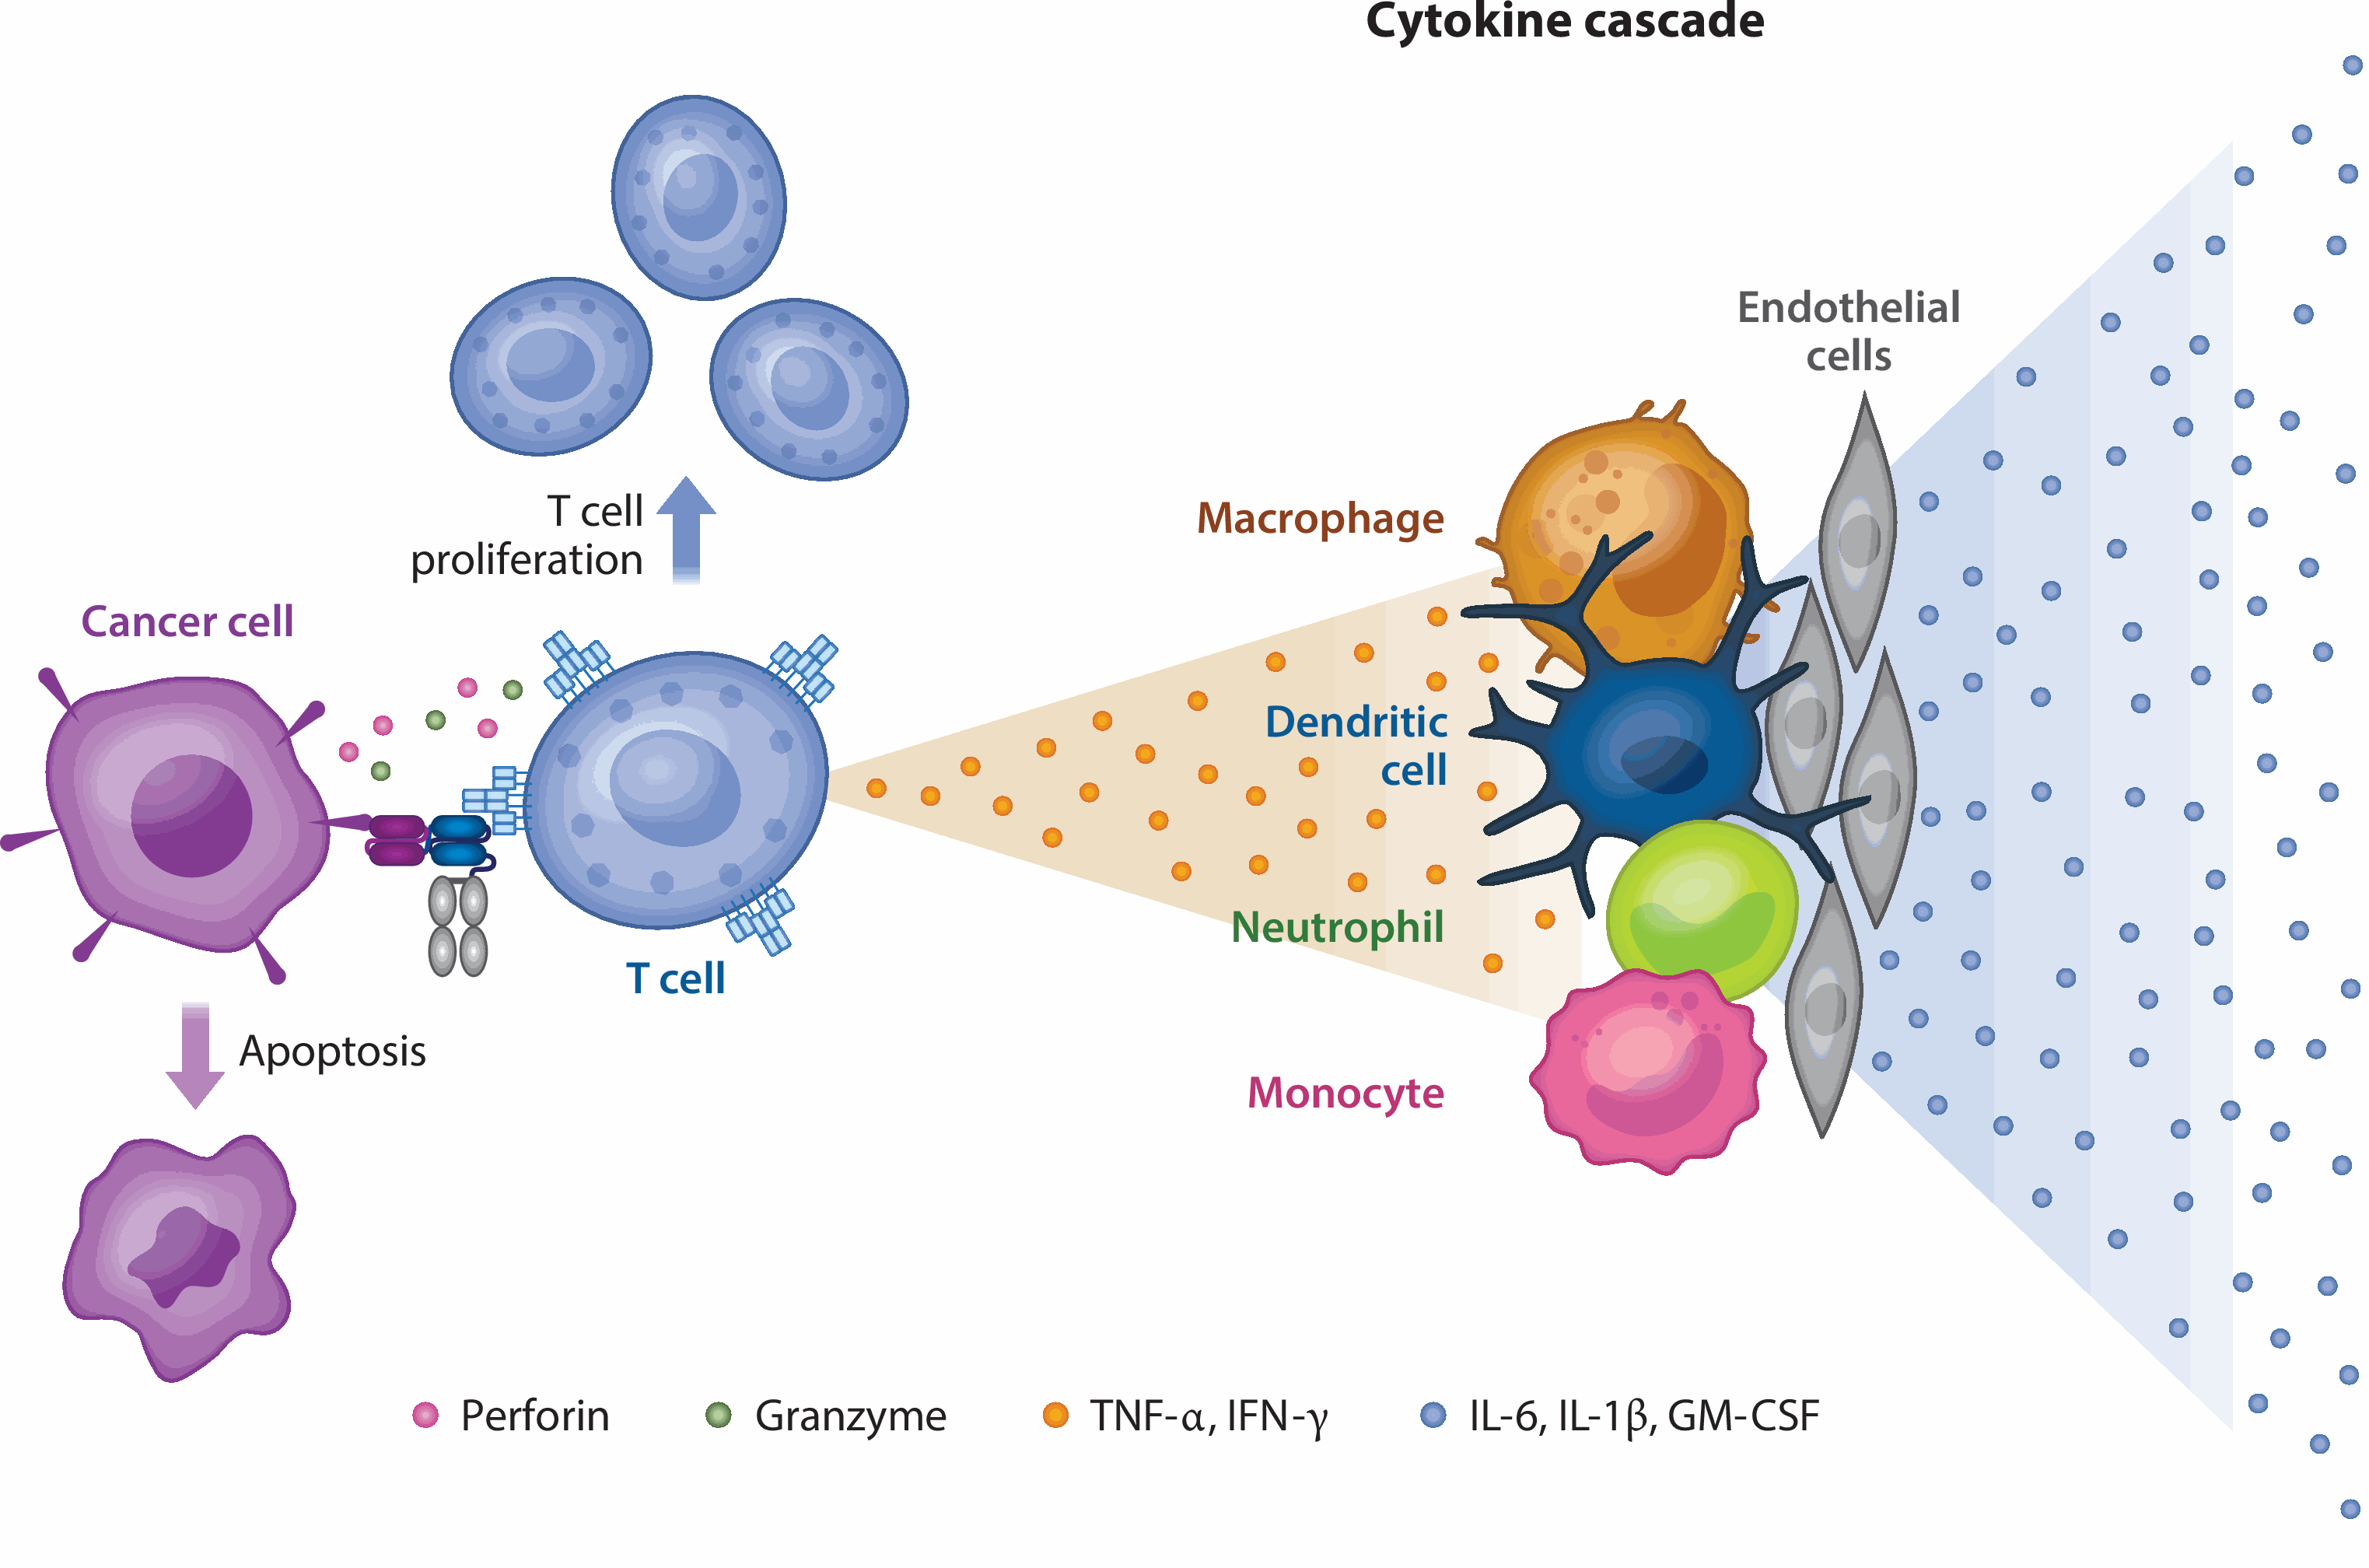
Figure 1. Action mechanism of TCE drugs [2]
Case Study 1: Tumor Cell Line Screening and Surface Antigen Quantification
Objective: Assess DLL3 surface expression across SCLC cell lines to determine suitability for TCE targeting. We employed flow cytometry to detect the positivity rate of cell-surface DLL3 and quantify antigen expression. Specifically, flow cytometric analysis was used to measure DLL3 protein expression levels in eight small cell lung cancer (SCLC) tumor cell lines. This enabled the characterization of target antigen density needed for subsequent TCE activity evaluation. Results showed that DLL3 was expressed in most cells, with SHP-77 having the highest expression (Figure 2, Table 1).

Figure 2. The protein expression levels of DLL3 in 8 Small Cell Lung Cancer (SCLC) tumor cell lines

Table 1. The surface DLL3 levels in 8 Small Cell Lung Cancer (SCLC) tumor cell lines
Case Study 2: Cellular Binding Assay
Objective: Evaluate Tarlatamab’s binding affinity to DLL3 on tumor cells and CD3 on T cells. Flow cytometry was employed to assess Tarlatamab binding to human CD3 on Jurkat cells (T-cell lymphoma line) and primary PBMCs, as well as to DLL3 on two SCLC cell lines. Fluorescence served as a quantitative marker for antibody-cell interaction. Results showed that Tarlatamab exhibited strong binding to DLL3, with fluorescence signals higher than those observed for CD3 binding.
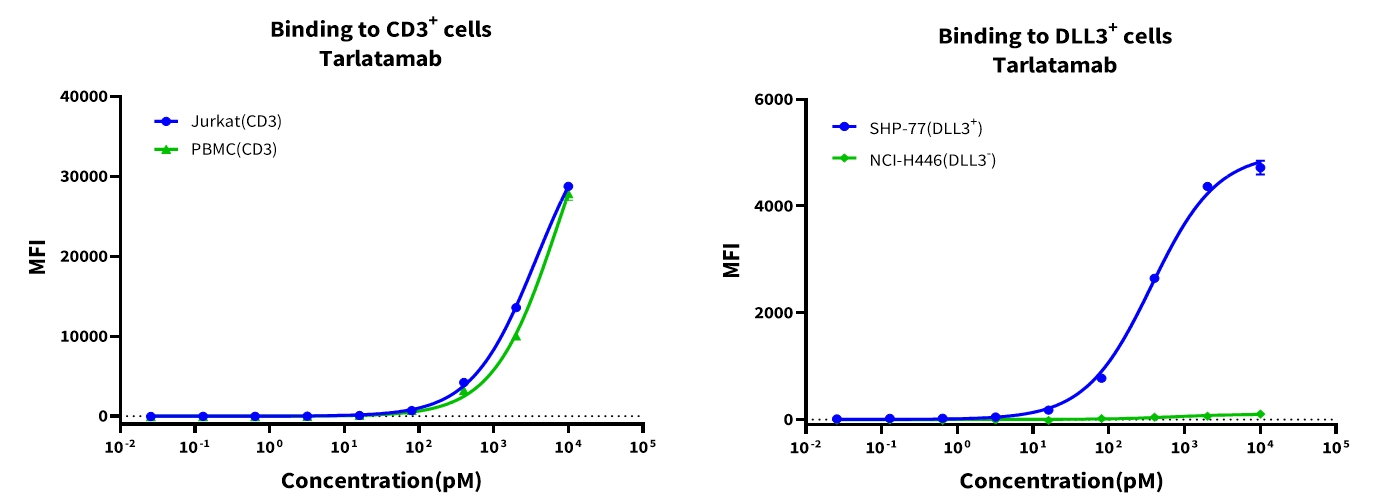
Figure 3. Cellular-level affinity analysis of CD3 (left) and DLL3 (right)
Case Study 3: Reporter Gene Assay for T-cell activation (NFAT-Luc Jurkat)
Objective: Measure T-cell activation via NFAT-driven luciferase expression in a co-culture system. Jurkat-NFAT-Luc cells co-cultured with SHP-77 were treated with Tarlatamab for 5 h. Luciferase activity was measured to assess NFAT activation and T-cell activation. Results showed Tarlatamab effectively triggered T-cell signaling in the tumor co-culture system. This method enables rapid assessment and screening of TCEs activity.
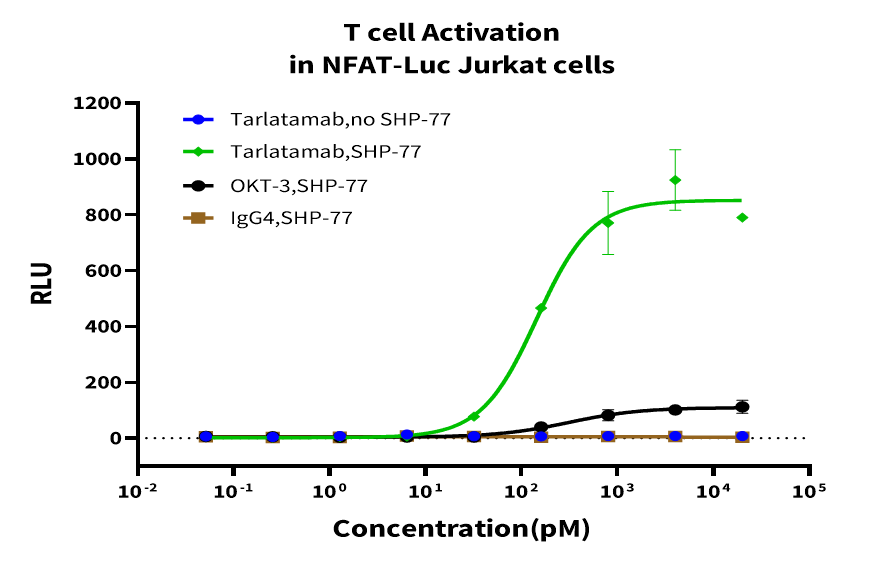
Figure 4. Luciferase Activity Assay of NFAT-Luc Jurkat Cell Activation
Case Study 4: T-cell Dependent Cellular Cytotoxicity (TDCC Assay)
Objective: Assess dose- and time-dependent tumor cell killing using primary PBMCs and engineered tumor cells.
Method 1: Flow Cytometry-Based TDCC Assay
CFSE-labeled tumor cells were co-cultured with PBMCs at a 5:1 effector-to-target (E:T) ratio for 48 hours, followed by SYTOX-AAD staining to quantify dead cells via flow cytometry. The percentage of SYTOX-AAD⁺ cells within the CFSE⁺ population directly reflects drug-mediated cytotoxicity. Results showed that Tarlatamab effectively enabled human PBMCs to kill SCLC cell lines, including those with low but detectable levels of DLL3 expression, and its cytotoxicity was positively correlated with co-incubation time.
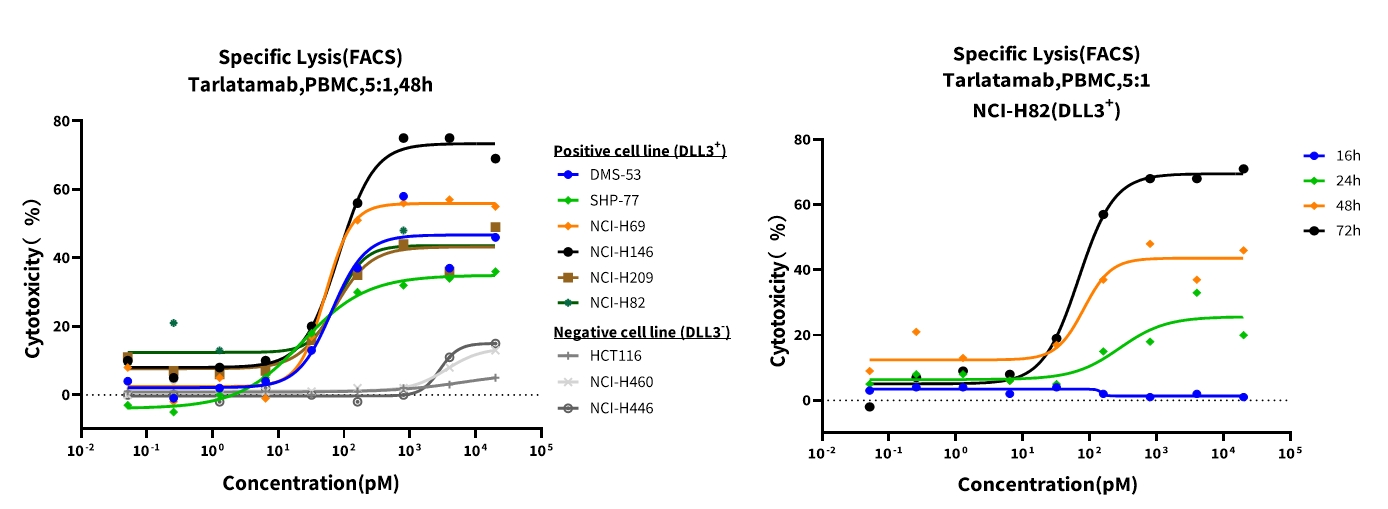
Figure 5. Time-point and dose-response curves of AMG 757 against representative SCLC cell lines
Method 2: Luciferase Reporter-Based Viability Assay
Luciferase-expressing tumor cells were co-cultured with PBMCs at an E:T ratio of 5:1 for 48 hours. Relative luminescence units (RLU) were measured and normalized to untreated control wells to calculate tumor cell killing (%). Results showed that Tarlatamab effectively enabled human PBMCs to kill NCI-H82-Luc cell lines, and its cytotoxicity was positively correlated with co-incubation time.
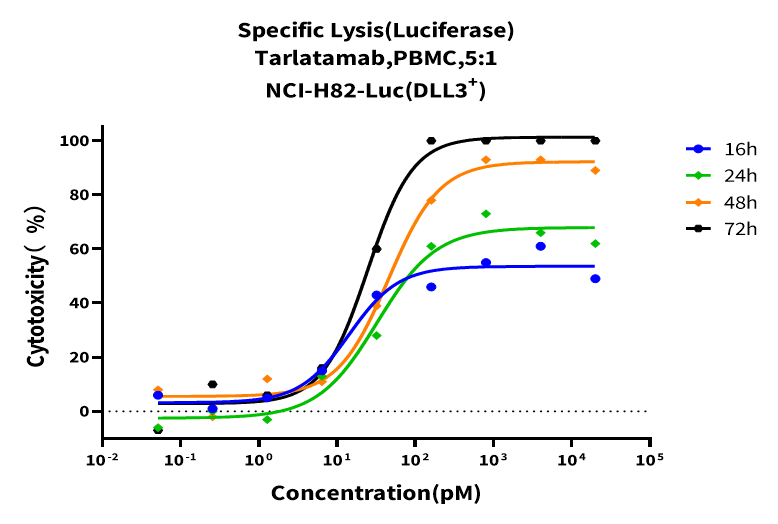
Figure 6. Time-point and dose-response curves of Tarlatamab against NCI-H82-Luc cell lines
Case Study 5: Cytokine Release in TDCC
Objective: Measure cytokine secretion following T-cell engagement and tumor cell killing. The levels of multiple cytokines in the supernatant were detected by the CBA (Cytometric Bead Array) method. Results showed that Tarlatamab induced a dose-dependent release of multiple cytokines in co-cultured tumor cells and PBMCs, with a peak at 48h, followed by a decline in IFN-γ release.
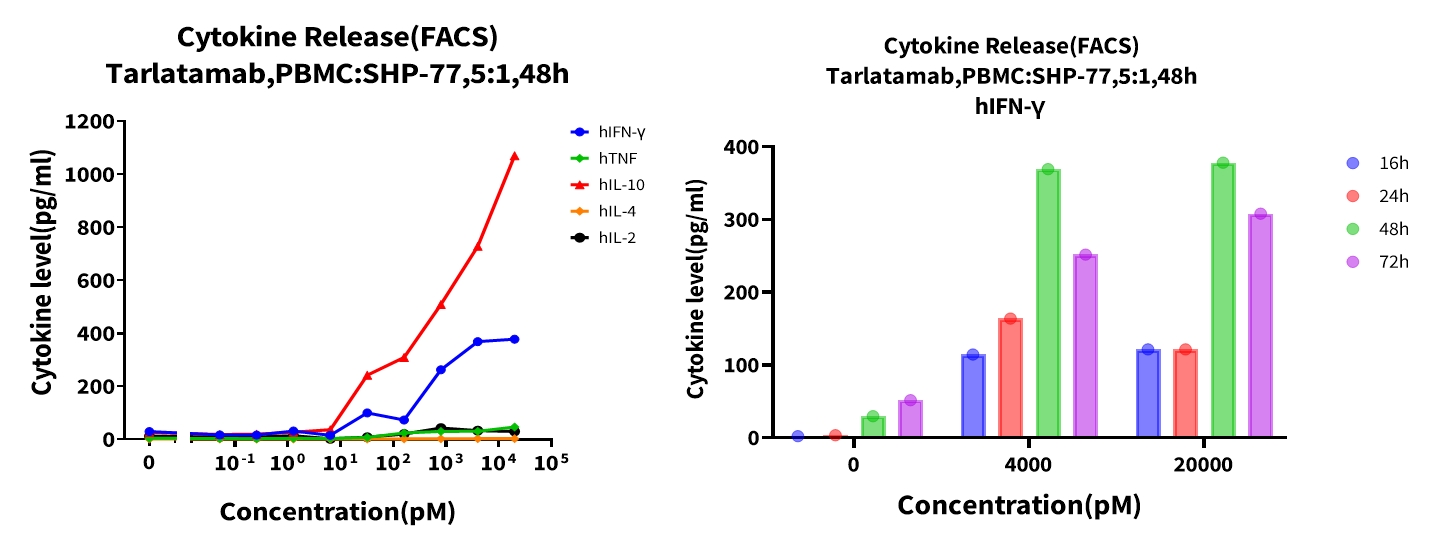
Figure 7. Dose-dependent cytokine release in co-cultured tumor cells and PBMCs
Case Study 6: T-Cell Activation in TDCC
Objective: Analyze the expression of CD69, CD25, CD71, CD137, PD-1, and PD-L1 to evaluate T-cell activation and exhaustion. T-cell activation was evaluated in co-cultures of PBMCs and tumor cells incubated at an effector-to-target (E: T) cell ratio of 5:1 with Tarlatamab for 48h. The percentage of CD69+, CD25+, CD71+, CD137+, PD-1+ and PD-L1+ T-cells was measured by flow cytometry. Results showed that Tarlatamab induced expression of T-cell activation markers on CD4⁺ and CD8⁺ T-cells, while upregulating PD-1 and PD-L1 expression simultaneously, providing rationale for subsequent combinatorial experiments with PD-1/PD-L1 Inhibitors. Additionally, T-cell activation markers were measured at different time points, revealing their dynamic expression patterns.
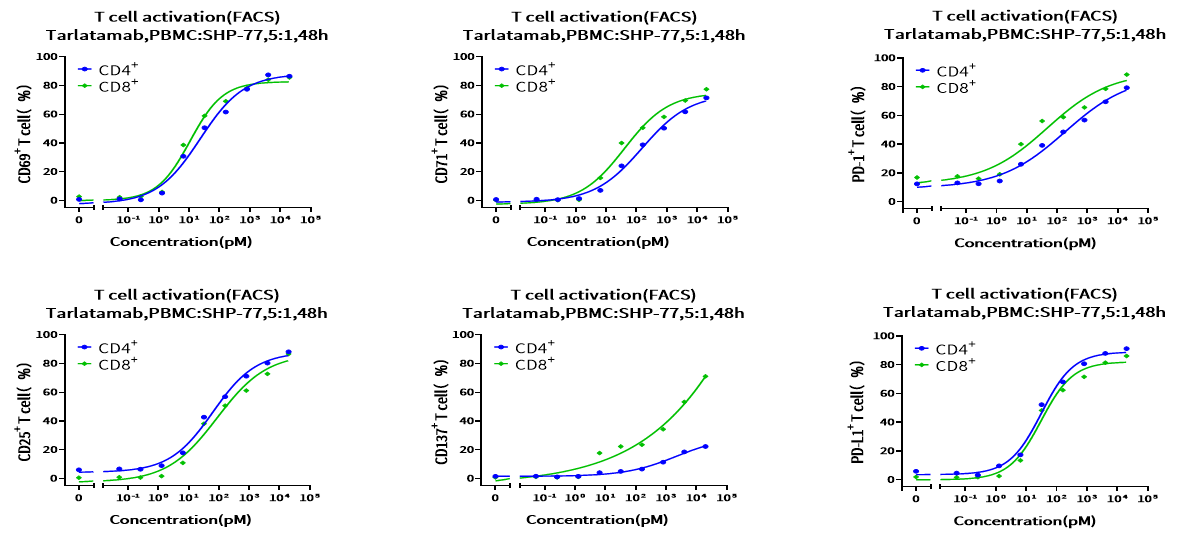
Figure 8. Biomarker expression on CD4+ and CD8+ T-cells by the treatment of Tarlatamab
Case Study 7: T-cell proliferation
Objective: To quantify T-cell proliferation in the presence or absence of DLL3-expressing tumor cells. Tarlatamab (4 nM and 0.08 nM) was incubated with CFSE labeled T-cells alone or co-cultured with SHP-77 (DLL3+) or NCI-H446 (DLL3-) cells for 3 days and analyzed by flow cytometry. Results showed that Tarlatamab induced T-cell proliferation in a strictly DLL3-dependent manner.
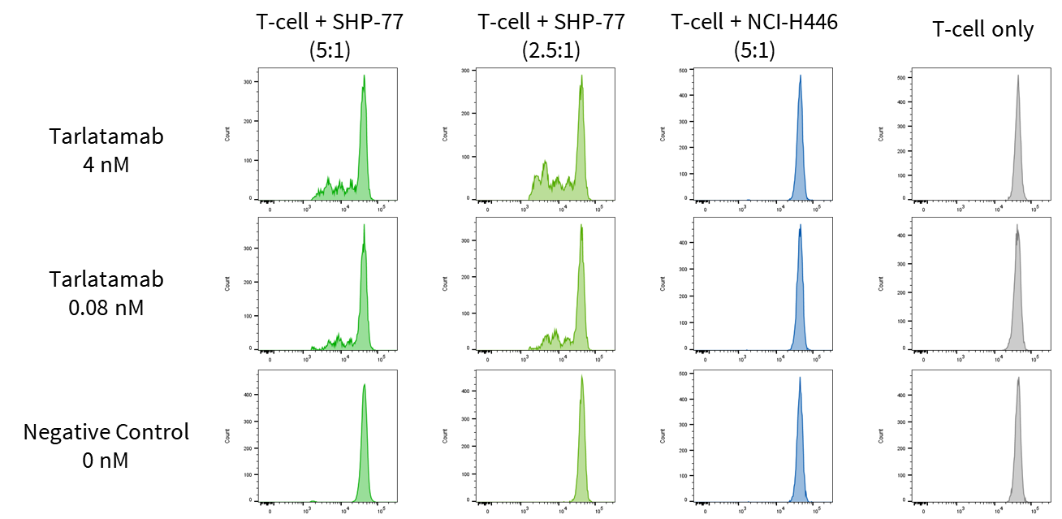
Figure 9. Tarlatamab increases T-cell proliferation
Case Study 8: Bystander Killing Effect
Objective: To evaluate whether Tarlatamab can induce T-cell-mediated elimination of nearby DLL3-negative tumor cells. The bystander killing effect refers to the nonspecific elimination of adjacent antigen-negative (Ag⁻) tumor cells by bispecific T-cell engagers (TCEs) during the targeted killing of antigen-positive (Ag⁺) cells. SHP-77 (Ag⁺) and NCI-H446 (Ag⁻) cells were co-cultured at three different ratios previously confirmed to not affect growth of non-tumor cell lines. NCI-H446 cells were engineered to express luciferase, and killing of Ag⁻ NCI-H446 cells was analyzed by measuring luciferase (Luc) activity. Results showed that TCE treatment induced killing of both SHP-77 and NCI-H446 cells. This bystander effect may reflect enhanced T-cell activation, contributing to secondary immune responses beyond direct antigen recognition.
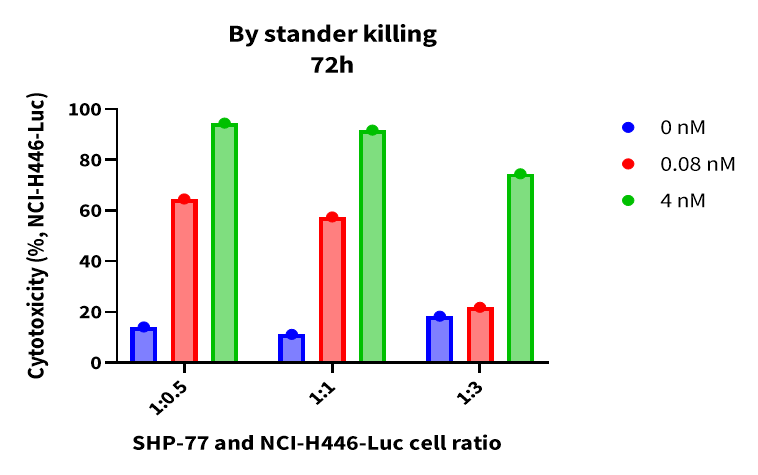
Figure 10. Tarlatamab induces killing of antigen-negative tumor cells.
GemPharmatech's TCE evaluation platform enables comprehensive in vitro assessment, from antigen profiling and binding affinity to immune activation and tumor cell killing. The Tarlatamab case study highlights the platform’s ability to generate mechanistic insights that inform therapeutic development, including potential combination strategies with immune checkpoint inhibitors. This robust suite of assays supports rational TCE candidate selection and optimization for preclinical success.
Contact us at sales@gempharmatech.com to learn how we can support your TCE program.
Reference
1.Salomon Tendler, et al., J Clin Oncol. 2023
2.Tara Arvedson, et al., Cancer Biol. 2022
3.Michael J. Giffin, et al., Clin Cancer Res 2021